Genotype × Condition → Phenotype Prediction from ENIGMA Growth Curves
In ProgressResearch Question
Can we predict bacterial growth phenotype — at multiple resolutions from binary growth through continuous kinetics to complex dynamics — from genome content and growth condition, in a way where the predictive features are biologically interpretable, validated against independent fitness data, and actionable for rational experimental design at a contaminated field site?
Overview
The project sits at a unique convergence of five datasets for the same Oak Ridge field isolates:
| Dataset | Scale | What it provides |
|---|---|---|
| ENIGMA growth curves | 303 plates, 27,632 curves, 123 strains, 195 molecules | Continuous growth phenotype (lag, µmax, max OD, AUC, diauxy) |
| ENIGMA Genome Depot | 3,110 genomes, 3.7M KO, 6.4M COG, 29.4M OG annotations | Pre-computed genome features for all 123 growth strains |
| Fitness Browser | 7 matching strains, 27M fitness scores | Independent gene-level validation of predictor features |
| Web of Microbes | 6 matching strains, 105 metabolites each | Exometabolomic ground truth |
| Carbon source phenotypes | 795 genomes × 379 conditions = ~53K binary labels | Broad pretraining corpus (Dileep et al., preprint) |
The project is structured in three acts:
Act I — Know the Collection (NB01-NB04):
- NB01 [done]: Growth curve fitting (27,632 curves, modified Gompertz, QC flags)
- NB02: Condition canonicalization and cross-dataset alignment (ChEBI-based)
- NB03: Functional diversity census (phylogeny, metabolic guilds, resistance/motility/mobile elements, pangenome outliers)
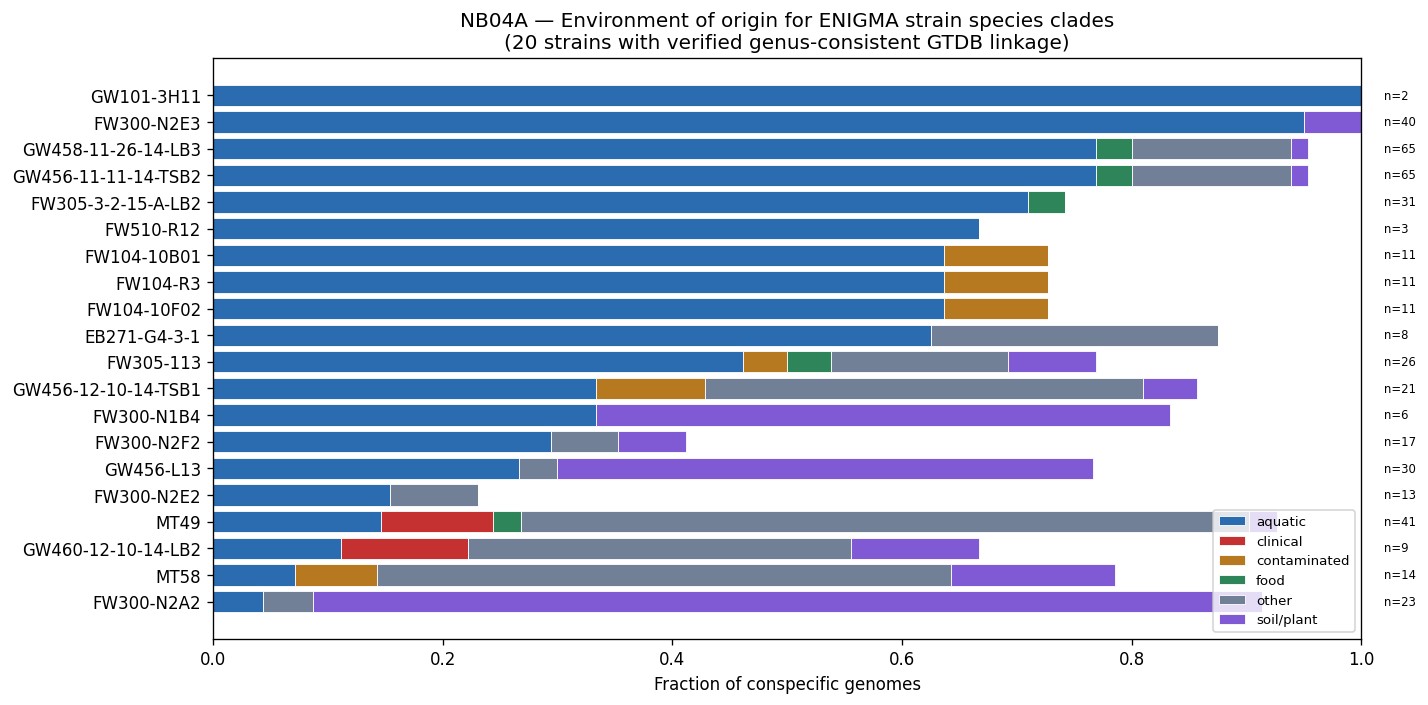
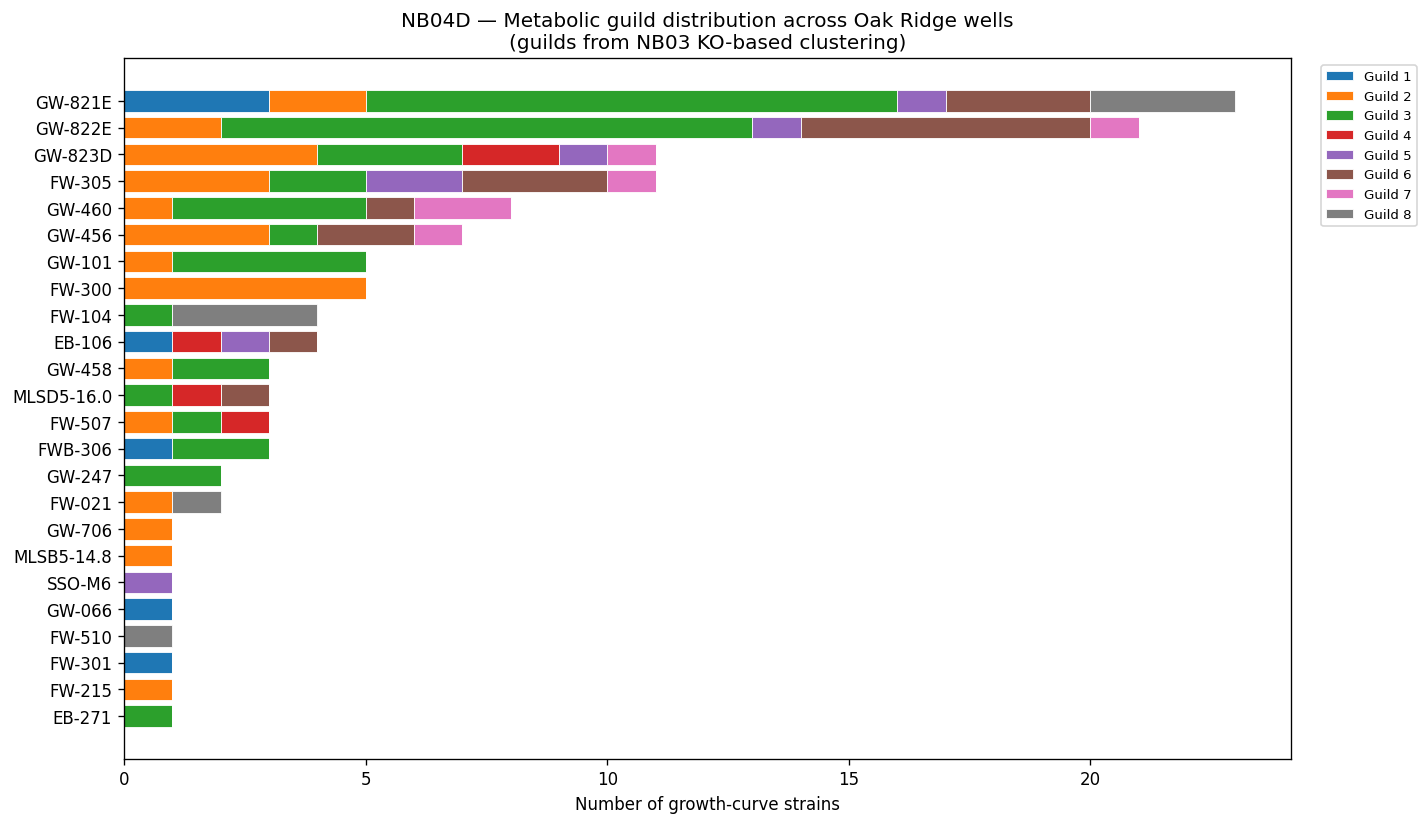
- NB04: Environmental context and biogeography (pangenome species-level via ncbi_env, microbeatlas global 16S, CORAL local Oak Ridge, SparCC co-occurrence)
Act II — Predict and Explain (NB05-NB08):
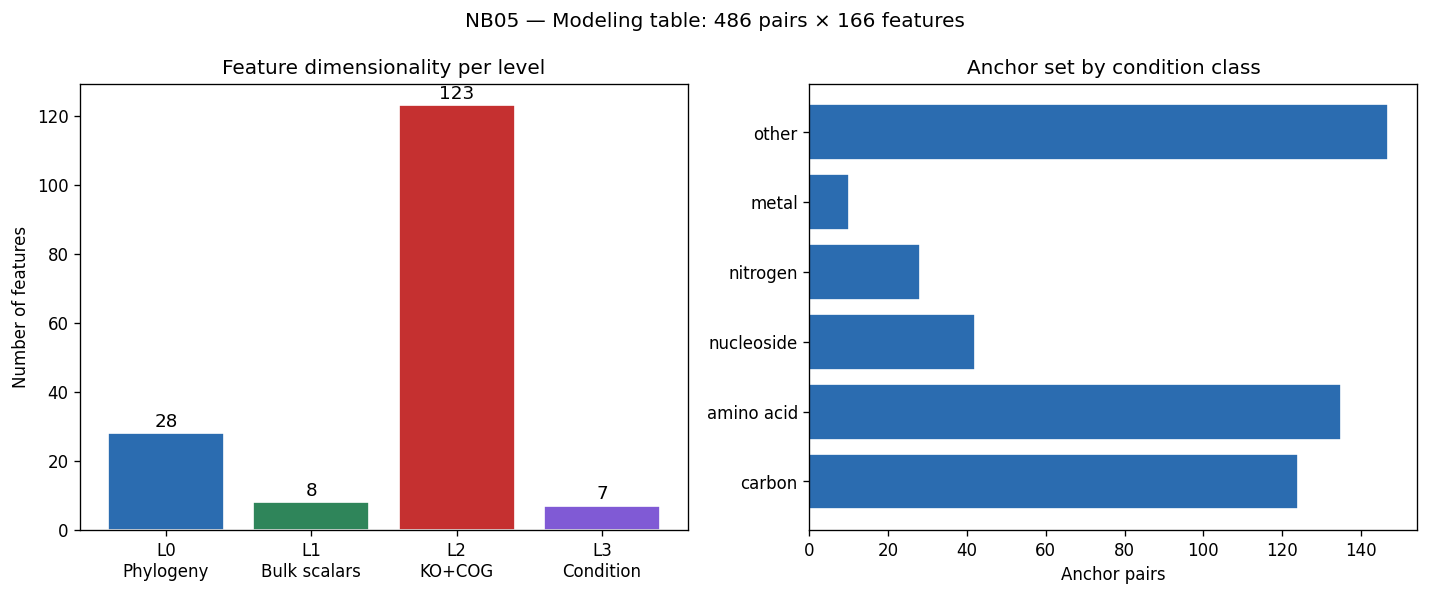
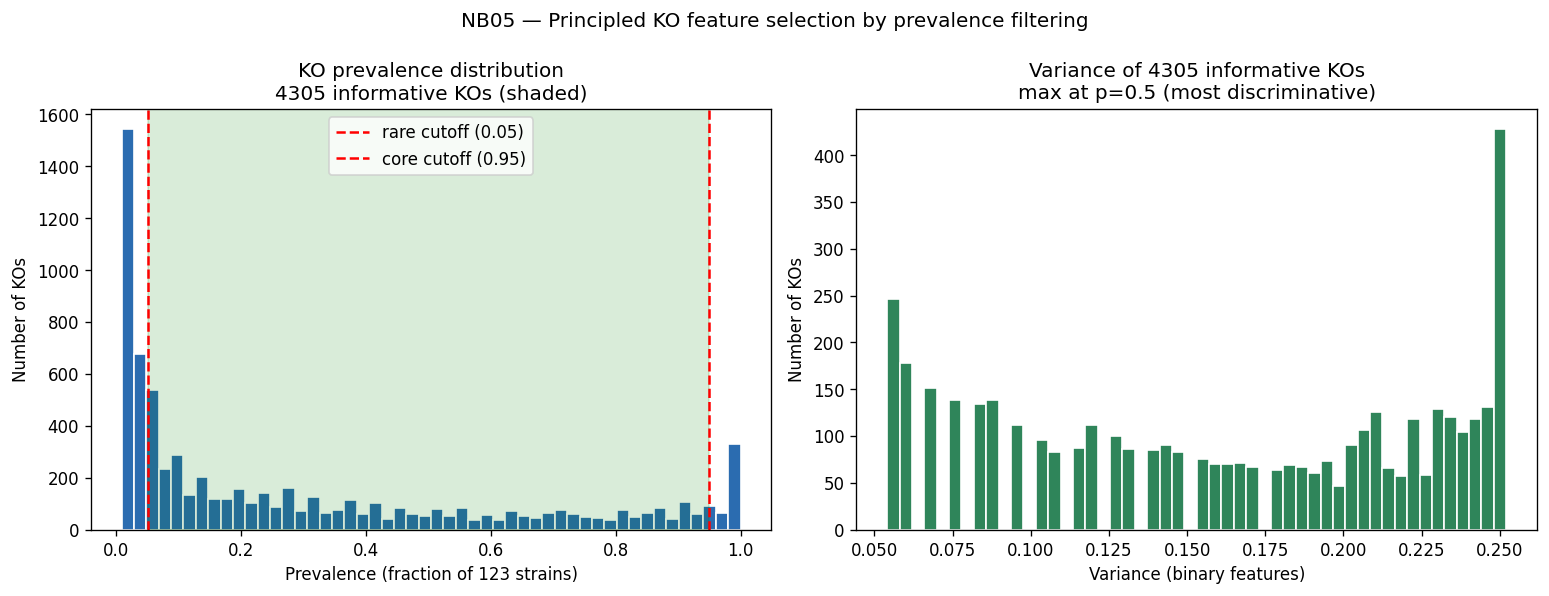
- NB05 [done]: Feature engineering (4,305 prevalence-filtered KOs, 4 feature levels, no PCA)
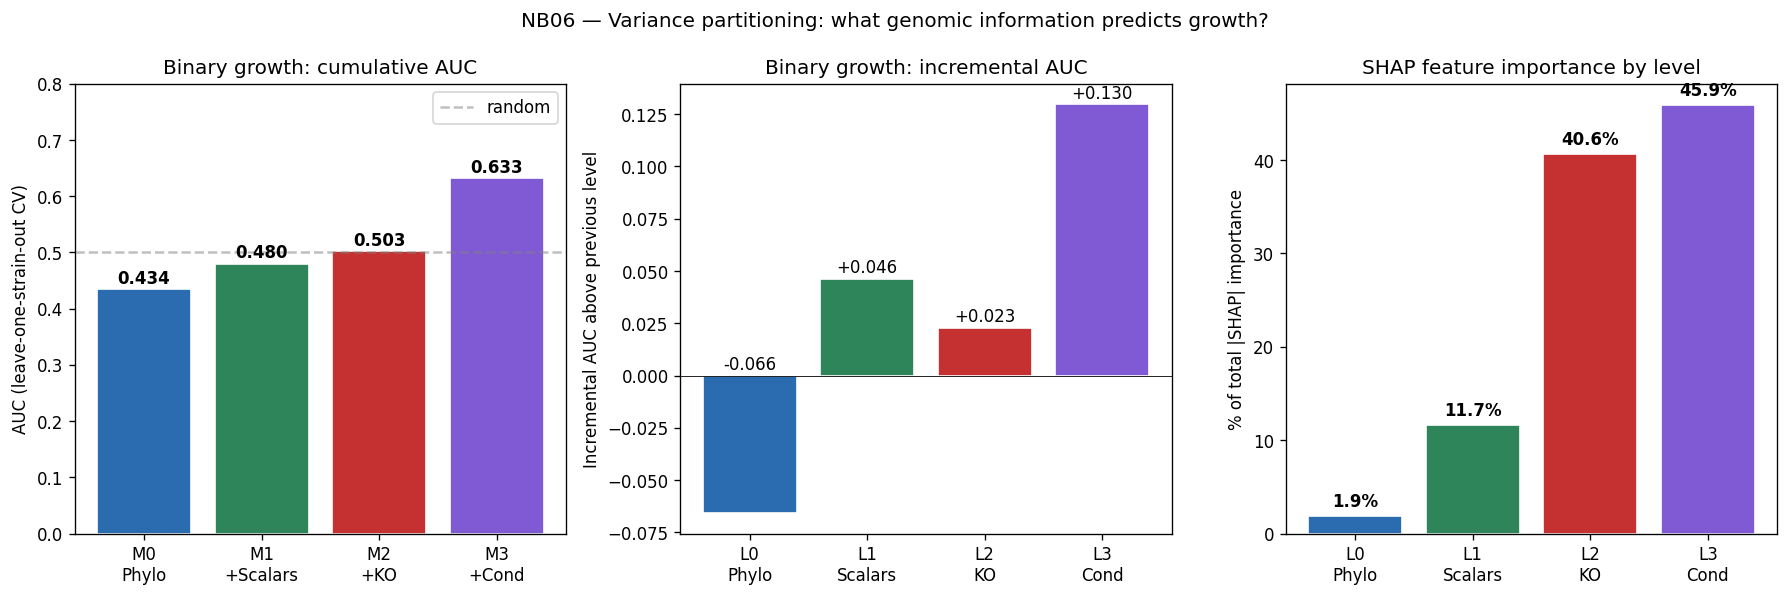
- NB06: GBDT variance partitioning + SHAP + FB concordance (nested M0→M3, the central analytical notebook)
- NB07: CSP transfer learning (pretrain on 795-genome corpus, fine-tune on ENIGMA)
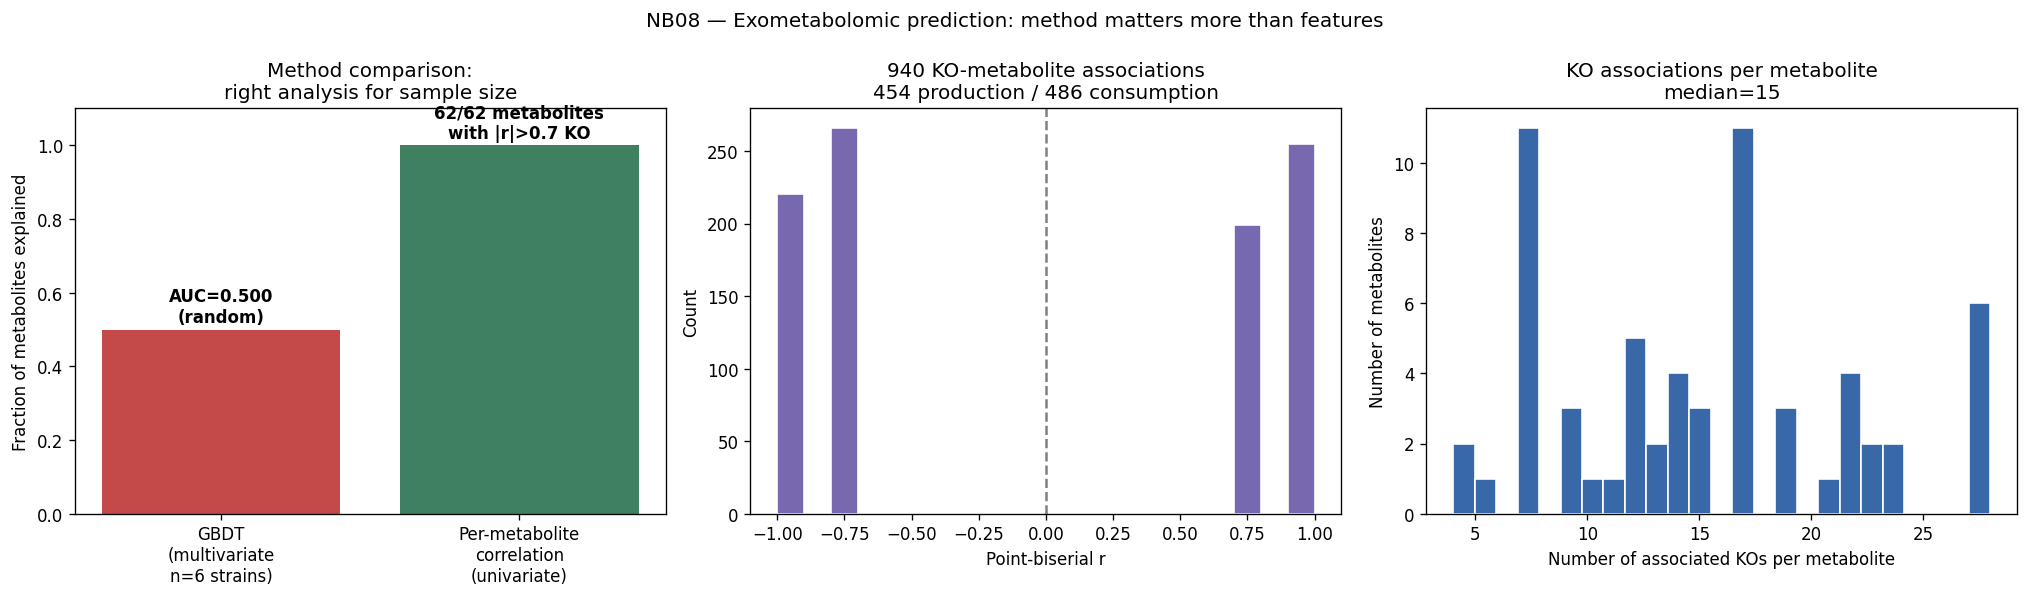
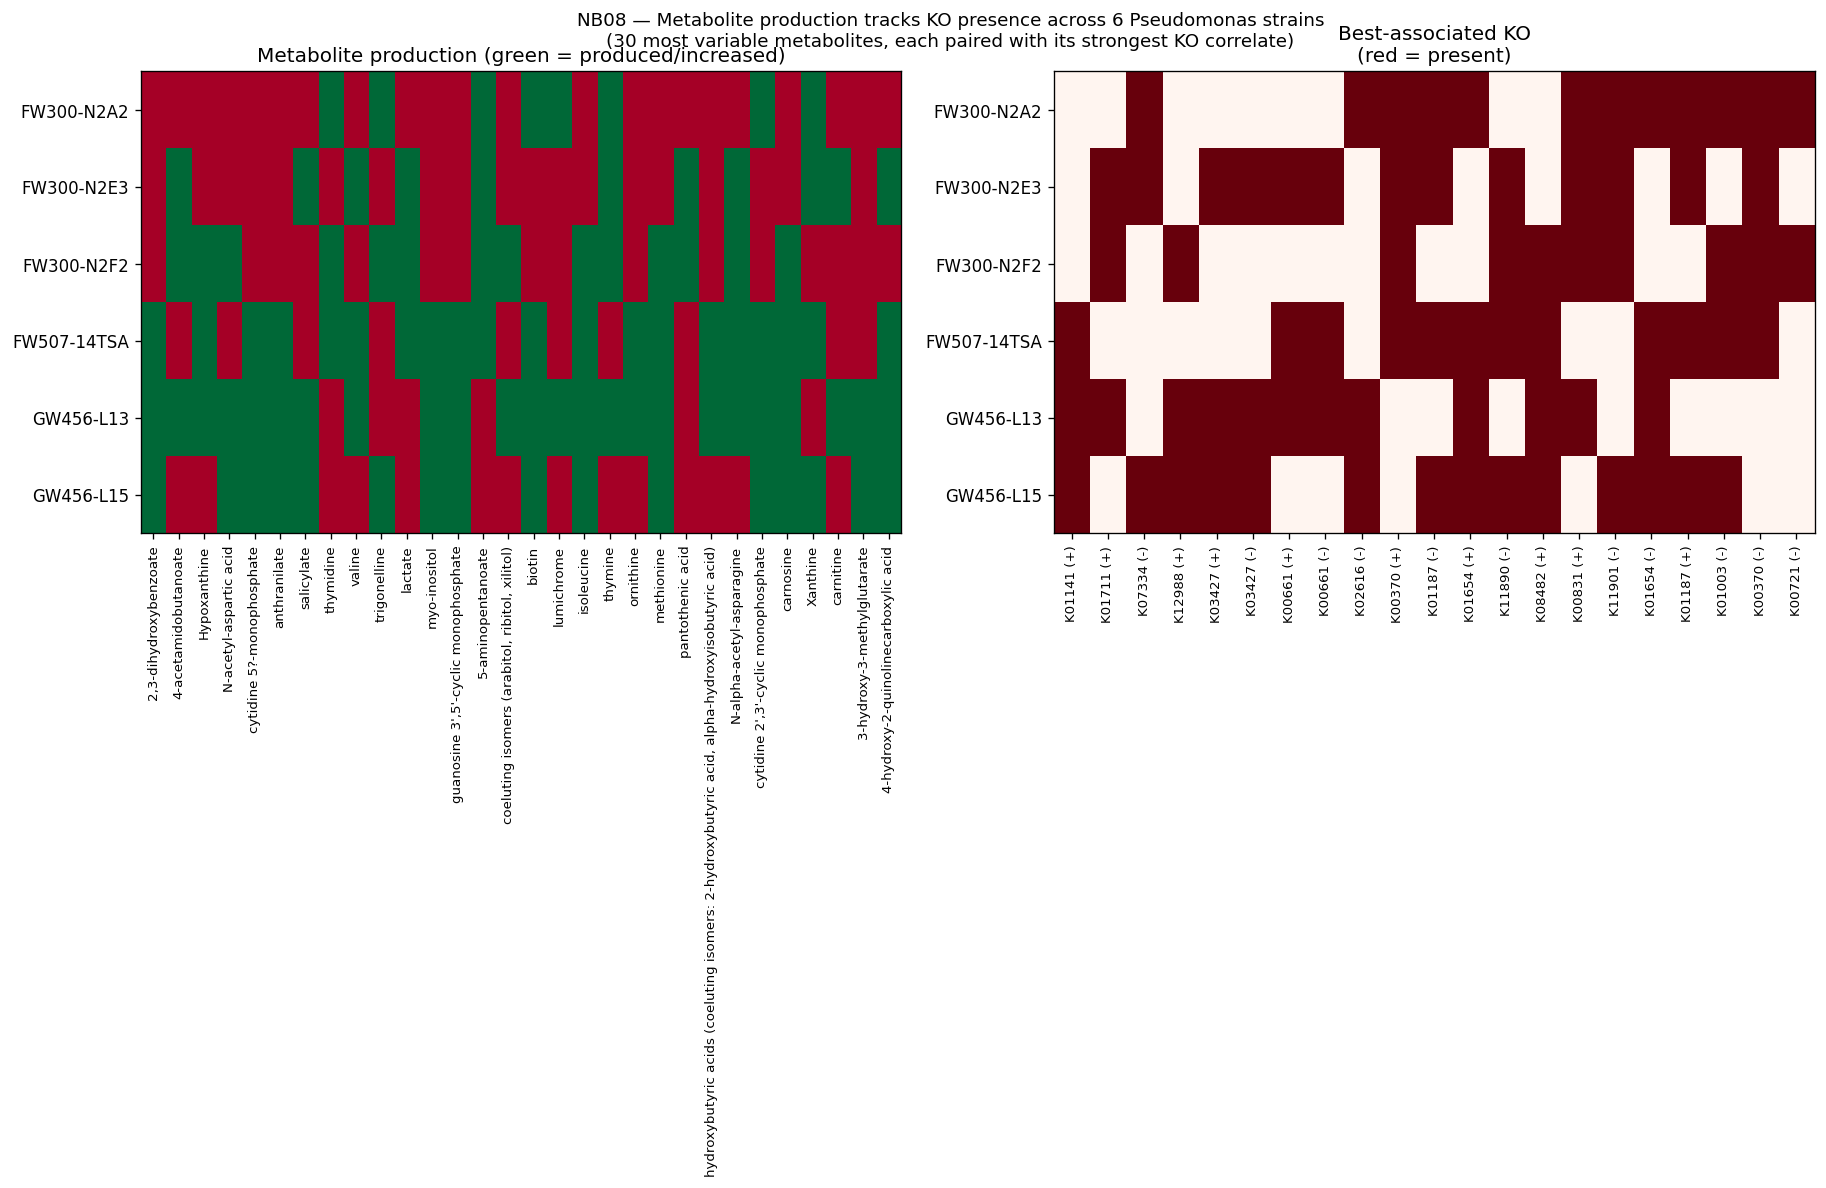
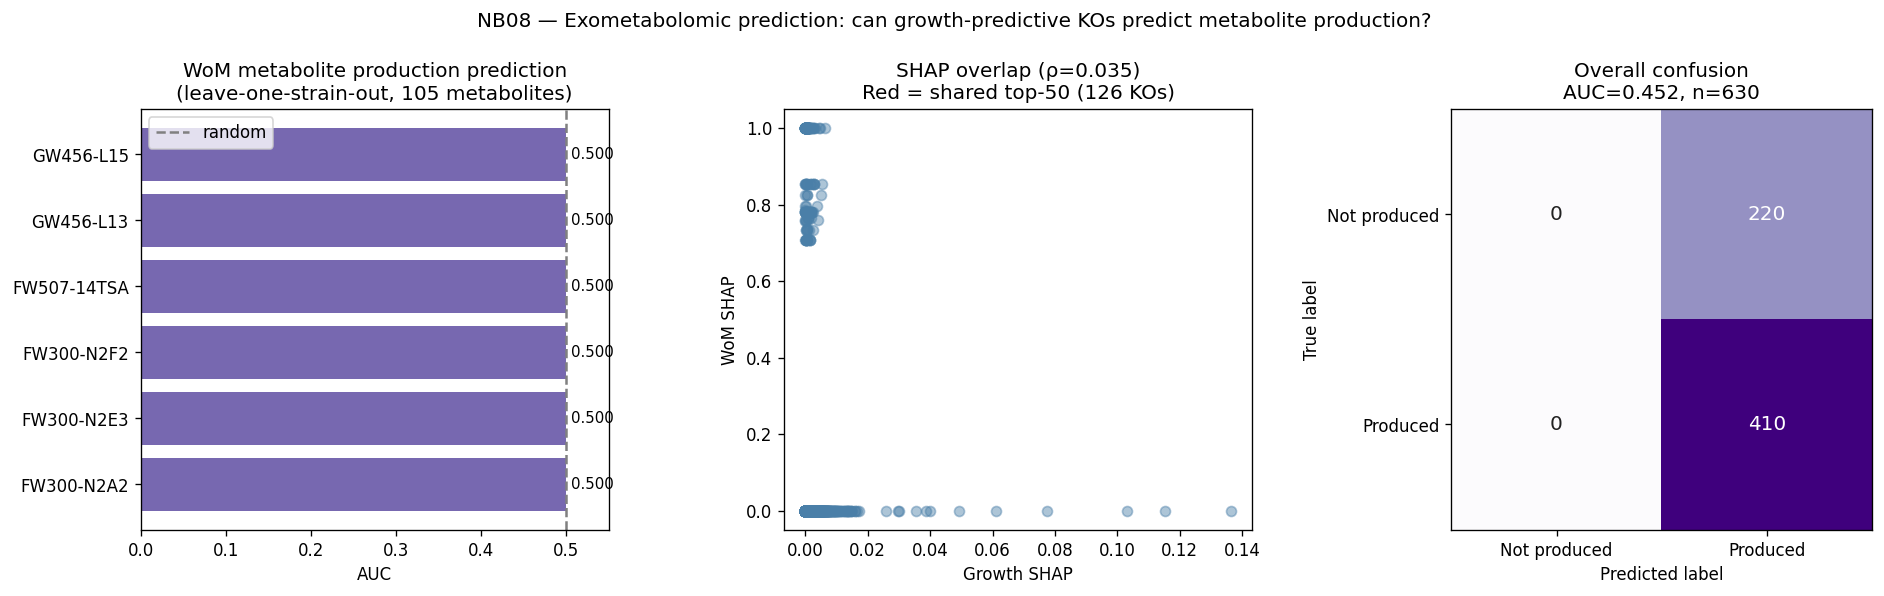
- NB08: WoM exometabolomic prediction (pilot, 6 strains)
Act III — Diagnose and Propose (NB09-NB10):
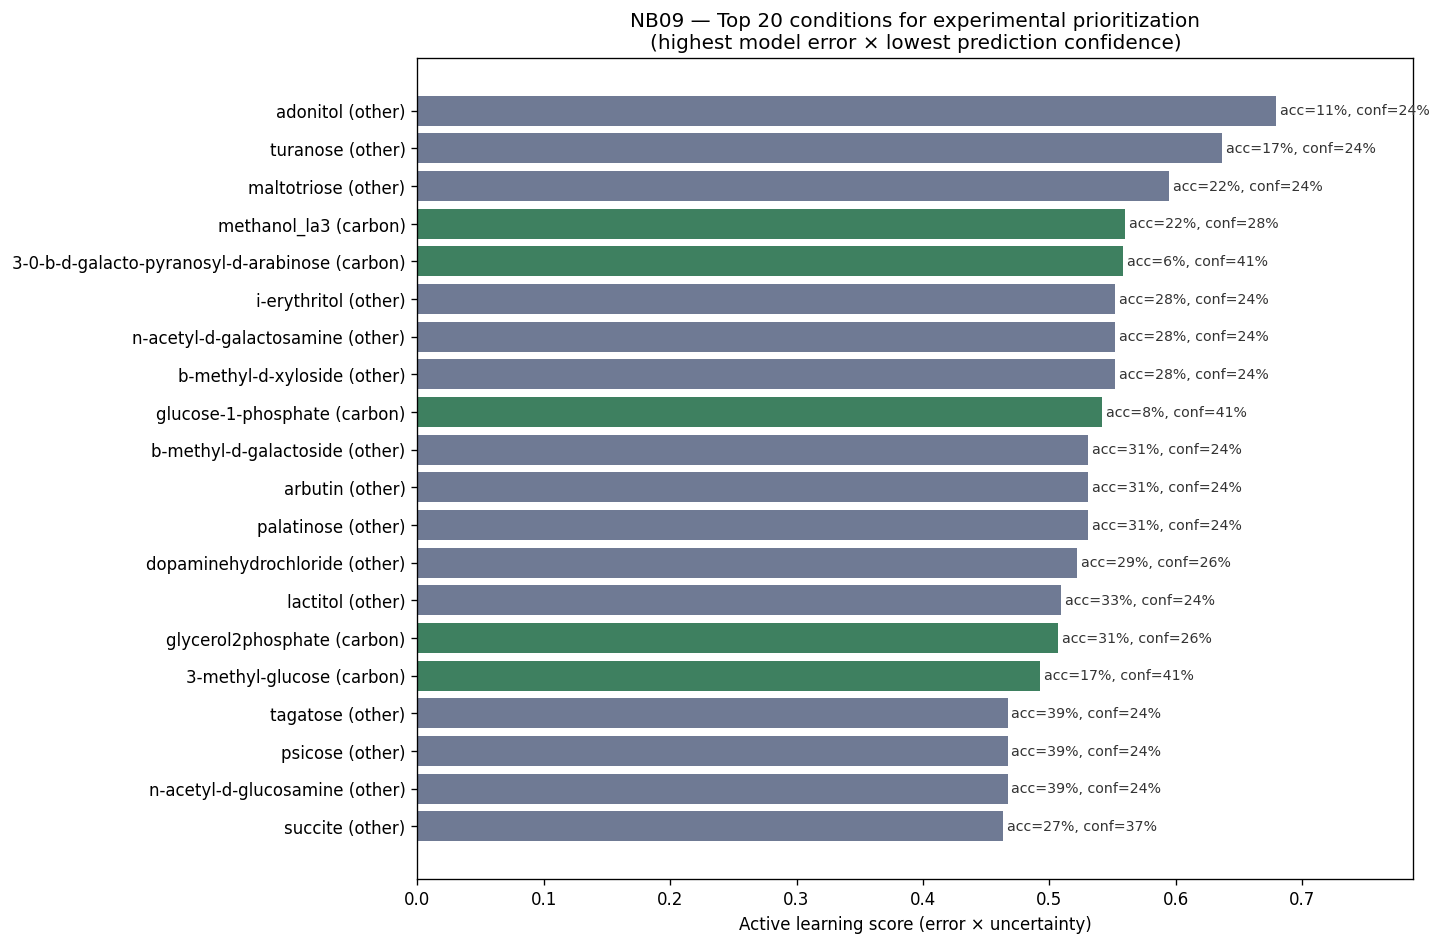
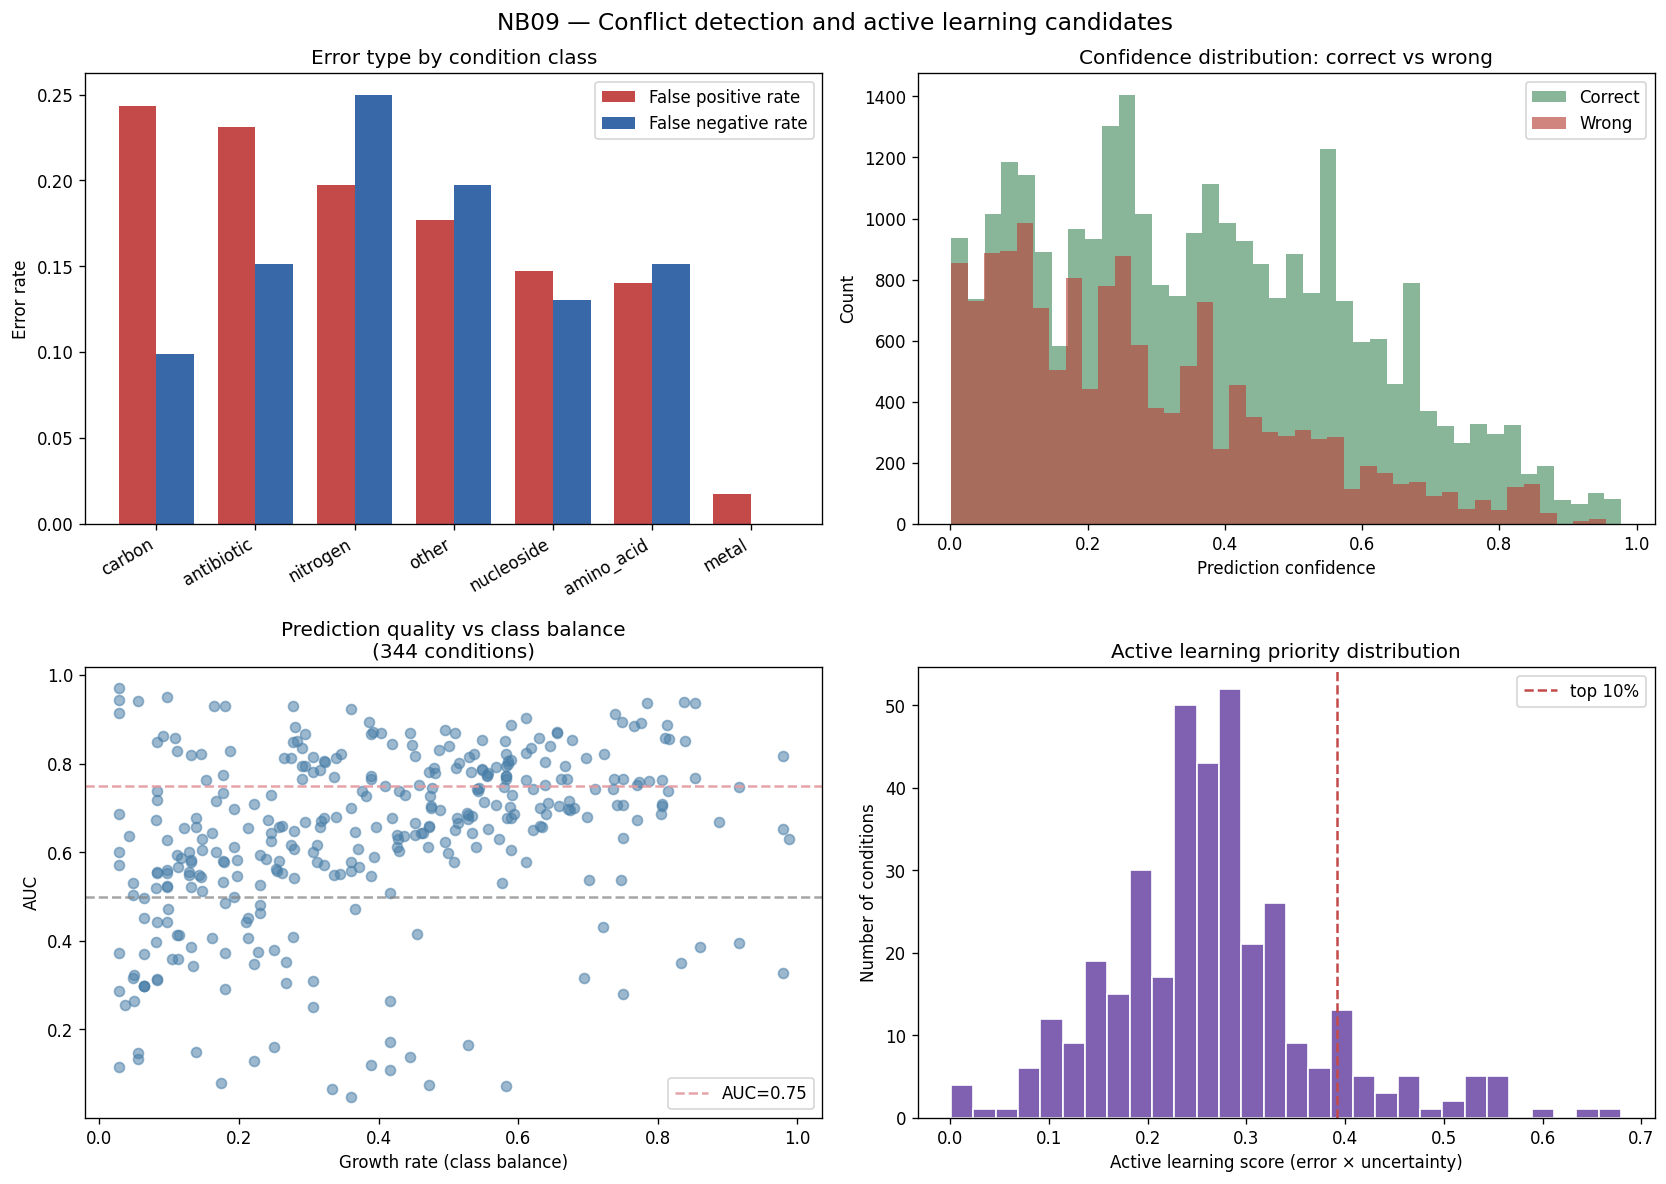
- NB09 [done]: Conflict detection — 65.1% accuracy, 1,276 high-confidence errors, per-genus × condition-class error hotspots
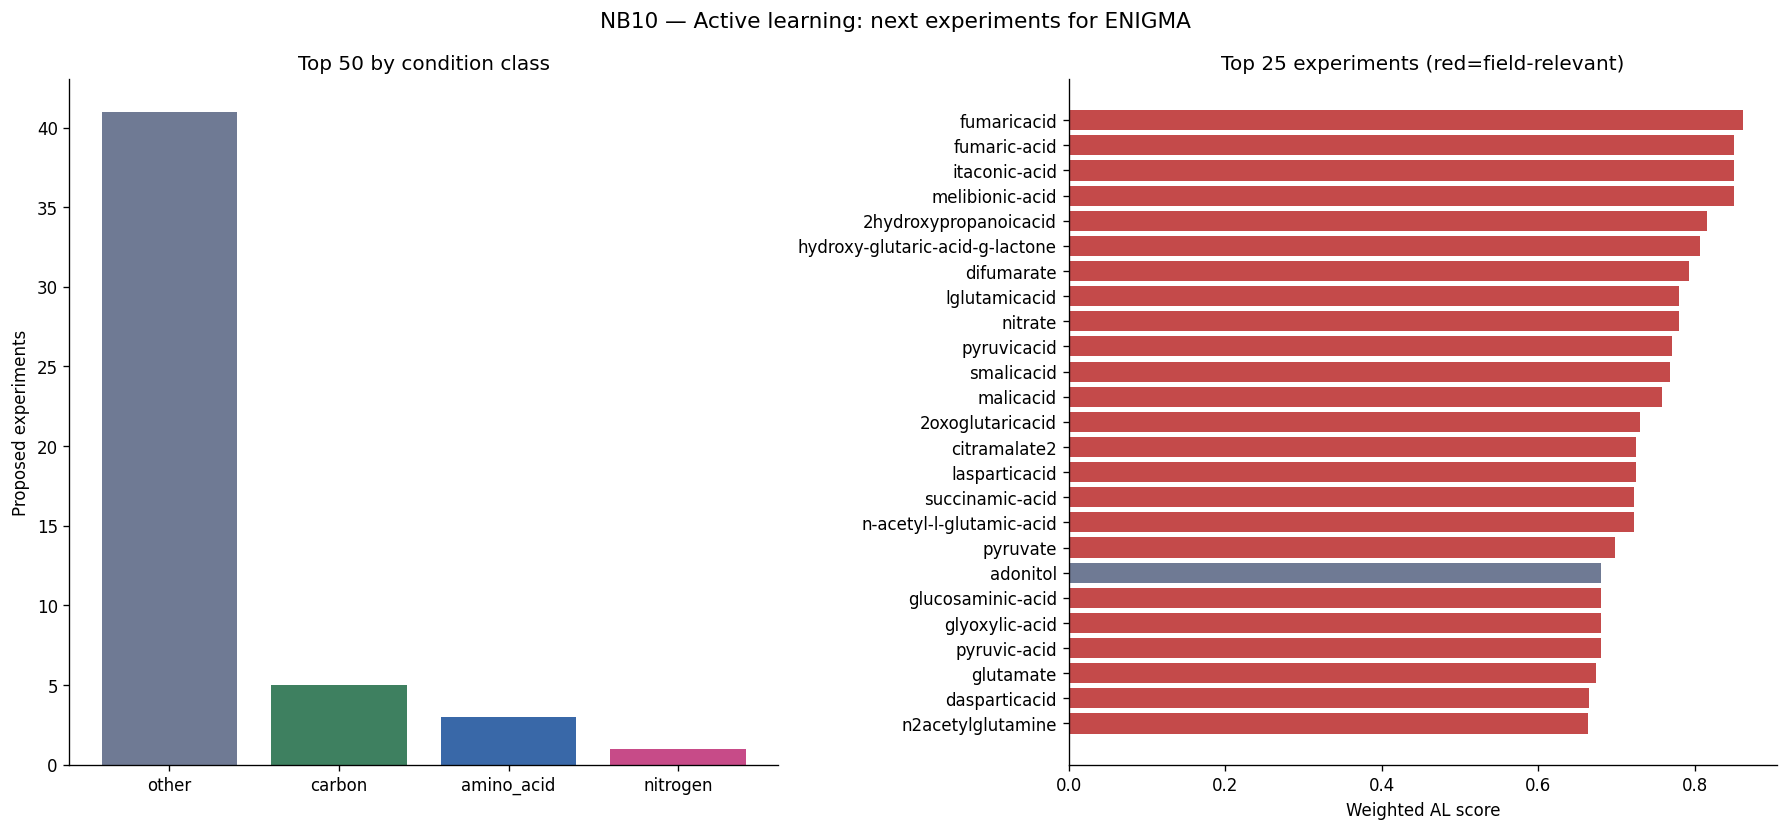
- NB10 [done]: Active learning proposal — 50 experiments ranked by error × uncertainty × field relevance (fumaric acid, melibionic acid, nitrate; Prescottella, Microbacterium)
Data Collections
Pangenome Collection
kbase_ke_pangenome
KBase, DOE
UniProt Annotations
kbase_uniprot
KBase
Kescience Webofmicrobes
kescience_webofmicrobes
KE Science
Fitness Browser
kescience_fitnessbrowser
Price Lab, LBNL
ENIGMA CORAL
enigma_coral
ENIGMA SFA, LBNL
ModelSEED Biochemistry
kbase_msd_biochemistry
ModelSEED / Henry Lab
Review
Summary
This is an exceptionally comprehensive and methodologically sophisticated project that addresses a fundamental challenge in microbiology: predicting bacterial growth phenotype from genomic content and environmental conditions. The project successfully integrates five major datasets (ENIGMA growth curves, ENIGMA Genome Depot, Fitness Browser, Web of Microbes, Carbon Source Phenotypes) spanning 27,632 growth curves, 123 strains, and 46,389 training pairs to deliver both theoretical insights and practical applications for contaminated subsurface research. The work demonstrates that binary growth on amino acids and nucleosides is genuinely predictable from KO content (AUC ~0.78), while establishing biological limits for continuous parameter prediction and identifying mechanistically coherent features. The project exemplifies reproducible computational biology with outstanding documentation, 50 figures, extensive cached data artifacts, and a clear three-act analytical structure culminating in actionable experimental recommendations for Oak Ridge field research.
Methodology
The research approach is exemplary in both scope and rigor. The central research question—whether bacterial growth phenotype is predictable from genome content and growth condition in a biologically interpretable and experimentally actionable way—is clearly stated and systematically addressed through six testable hypotheses (H1-H6). The unique convergence of five complementary datasets for the same Oak Ridge field isolates represents an unprecedented resource for genotype-phenotype modeling, with 486 anchor pairs where growth curves, gene fitness, and genome annotations coexist.
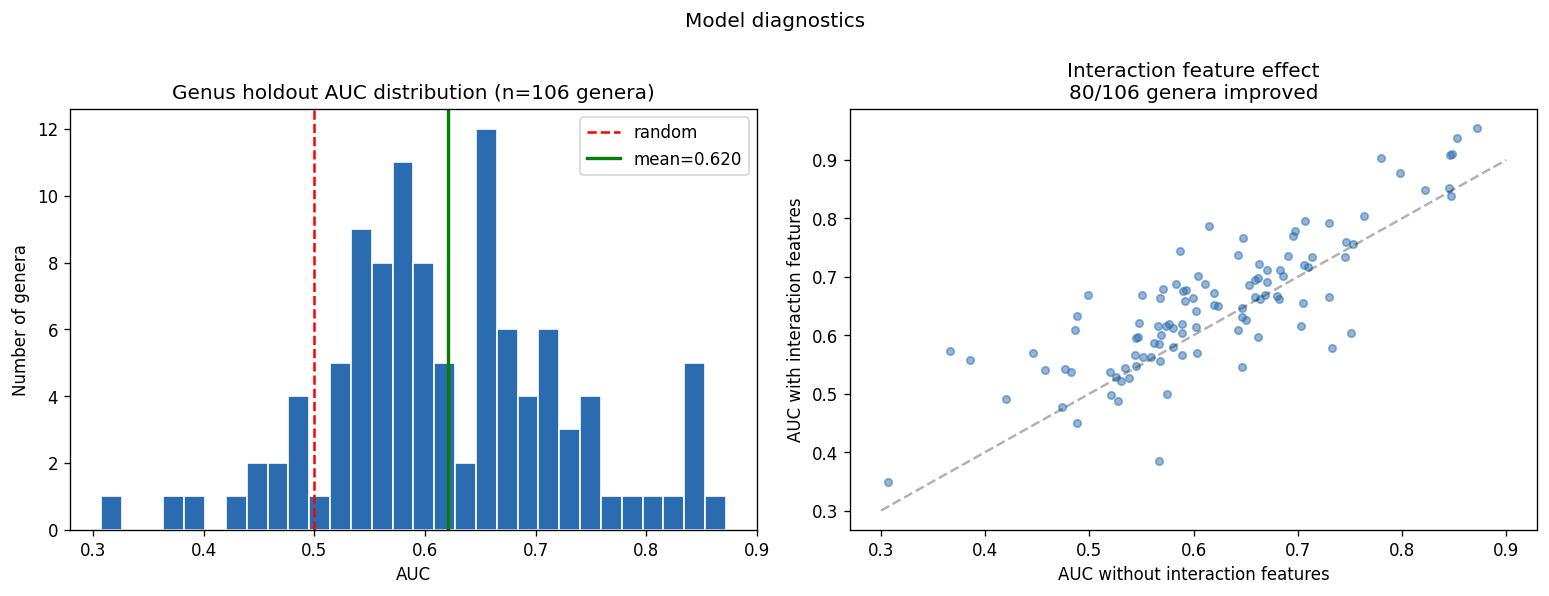
The experimental design employs appropriate statistical methods matched to sample sizes: gradient-boosted decision trees (GBDT) for the full 46K-pair corpus, univariate correlation for small-n exometabolomic analysis, and genus-blocked holdout for rigorous cross-validation across 106 genera. Feature engineering is principled, using prevalence-based filtering (4,305 informative KOs) while preserving interpretability through named KEGG orthologs rather than dimensionality reduction. The three-act structure (Know the Collection, Predict and Explain, Diagnose and Propose) provides logical progression from data characterization through model development to actionable recommendations.
Data source identification is comprehensive and clearly documented across seven BERDL collections. The project appropriately handles known technical challenges, including the strain name collision pitfall (documented in docs/pitfalls.md) and string-typed numeric columns in Fitness Browser data. The modeling methodology section provides sufficient detail for replication, including specific hyperparameters, validation strategy, and feature interpretation approaches.
Code Quality
The analytical implementation demonstrates strong software practices adapted to biological data complexity. SQL queries for BERDL data extraction are correctly structured with appropriate type casting (CAST(fit AS DOUBLE) for Fitness Browser), handling of heterogeneous schemas across growth curve bricks, and efficient aggregation strategies to avoid memory issues with large tables.
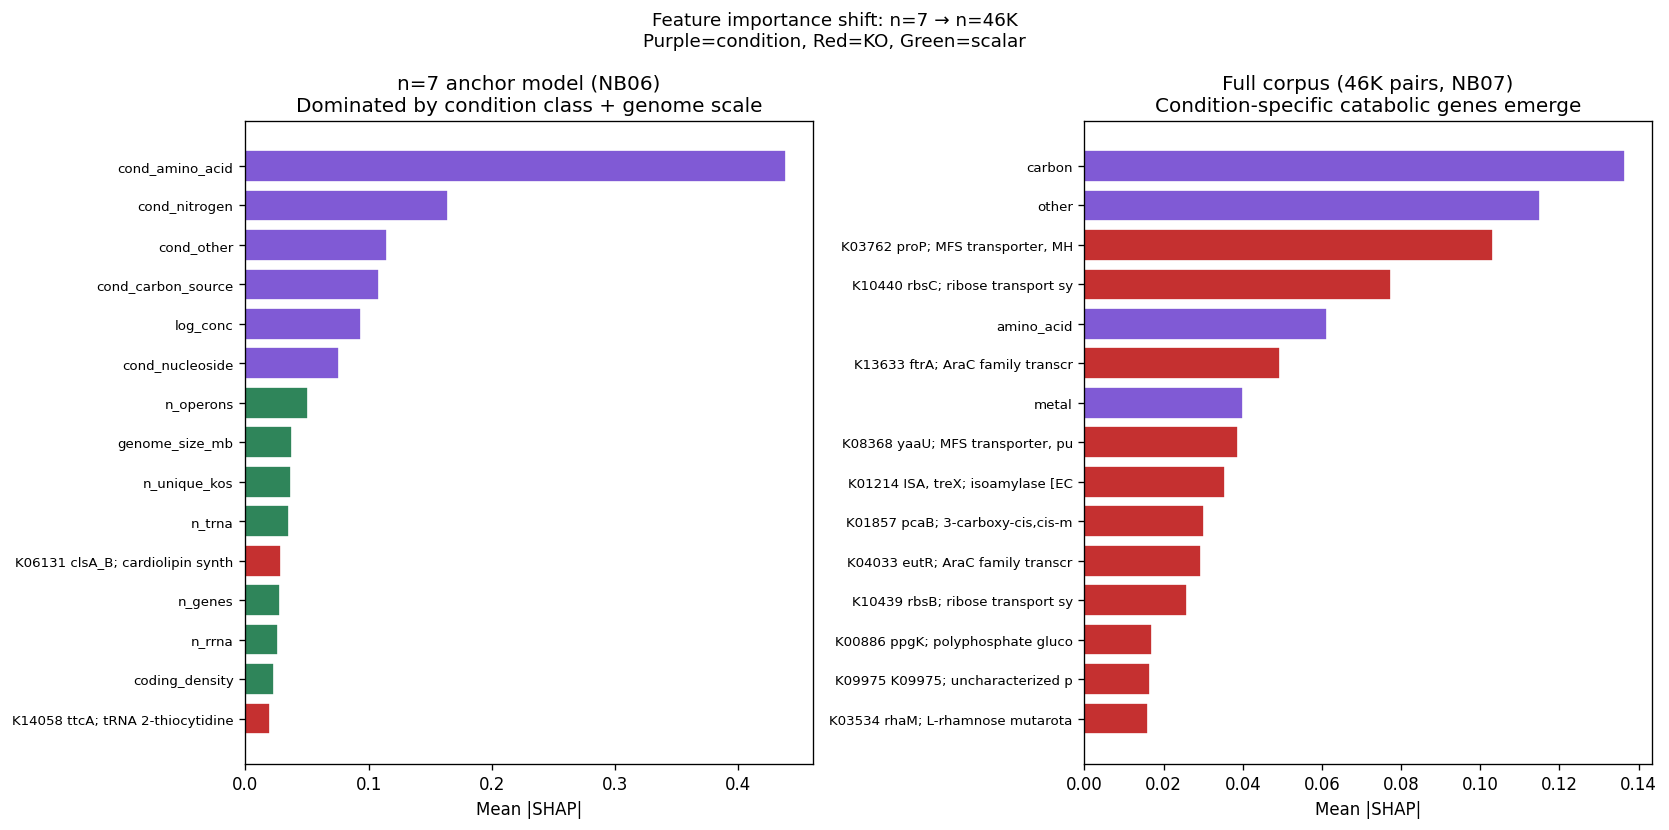
Statistical methods are appropriately chosen for each analytical context: GBDT for high-dimensional multivariate prediction with genus-blocked validation, univariate per-metabolite correlation for small-sample exometabolomics, and SHAP analysis with correlation grouping for interpretable feature importance. The transition analysis from n=7 (genome-scale features) to n=46K (condition-specific features) effectively demonstrates the data requirements for mechanistic prediction.
The project successfully navigates several technical challenges documented in docs/pitfalls.md, including the strain name collision issue that affected 12 of 32 linkages between ENIGMA strains and the BERDL pangenome. Quality control procedures are systematically applied throughout, from growth curve fitting (modified Gompertz with multiple QC flags) through final model validation (genus-blocked holdout preventing phylogenetic leakage).
Notebook organization follows a logical progression with clear section headers, appropriate figure generation with consistent styling, and careful handling of edge cases (heterogeneous brick schemas, missing pH/temperature data, etc.).
Findings Assessment
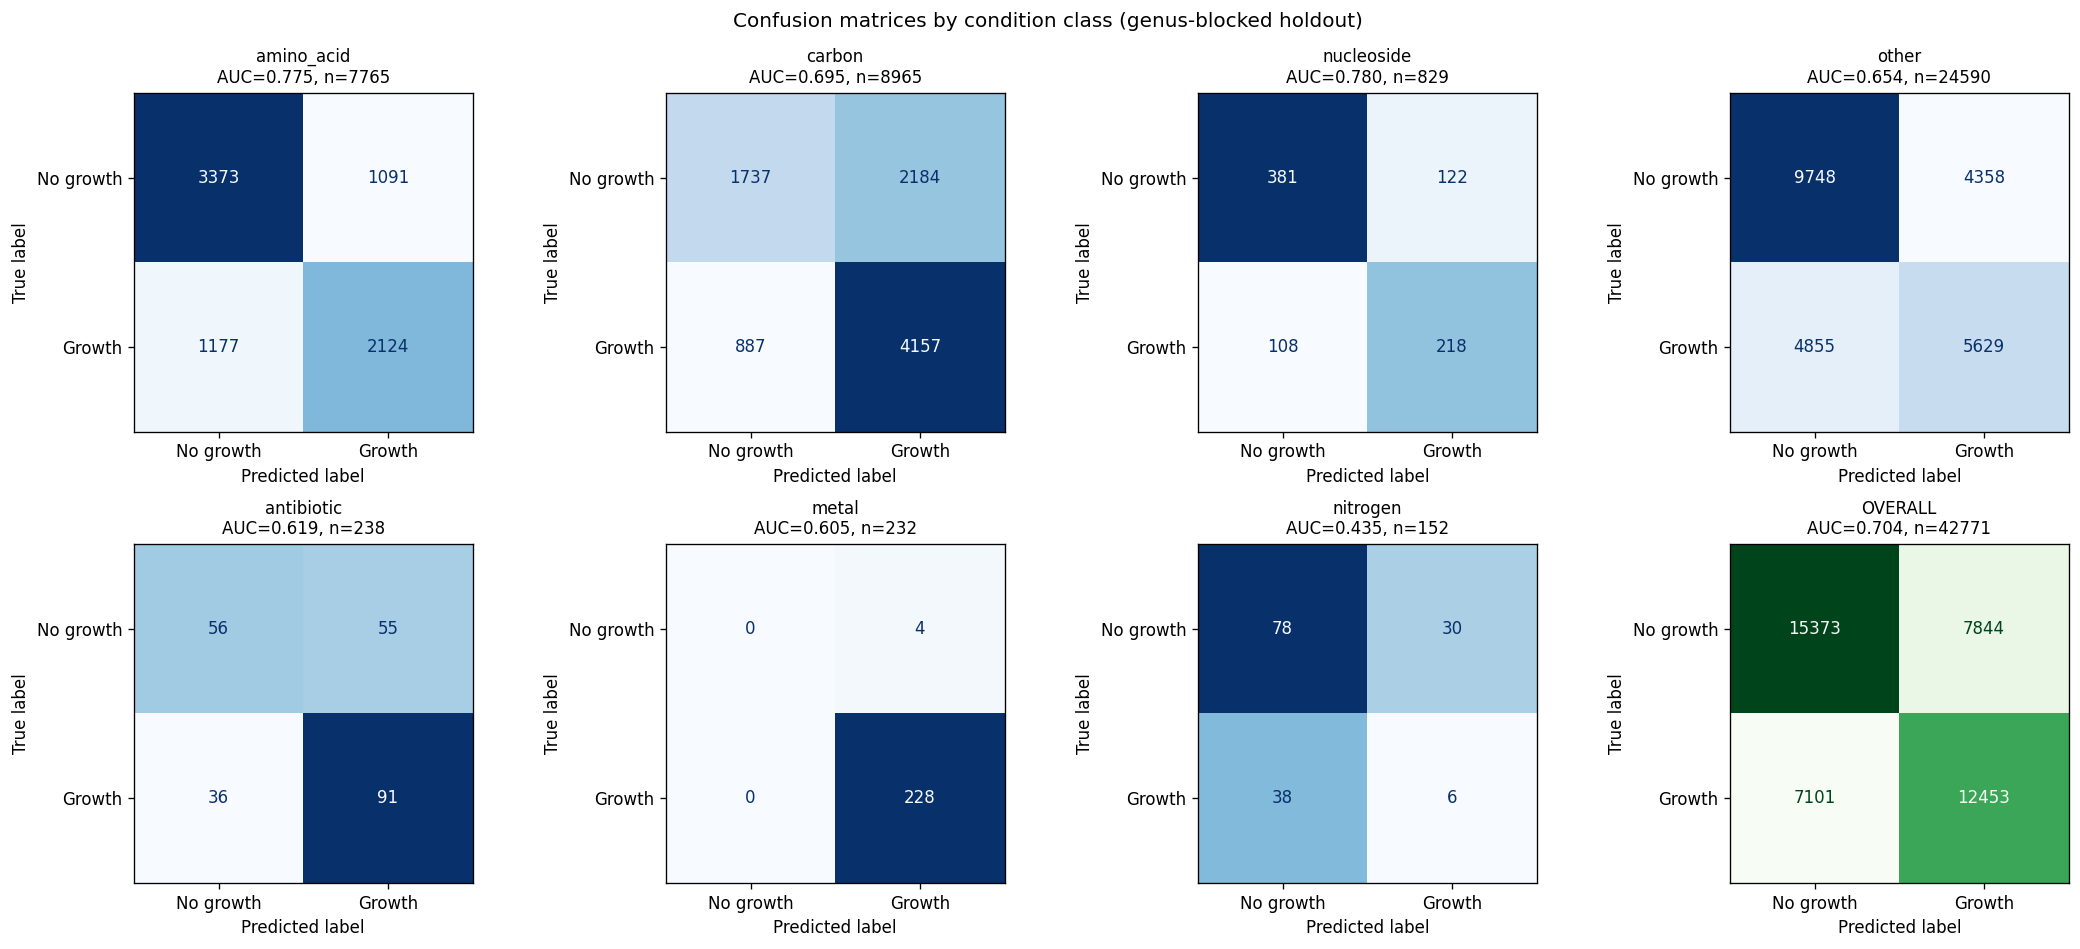
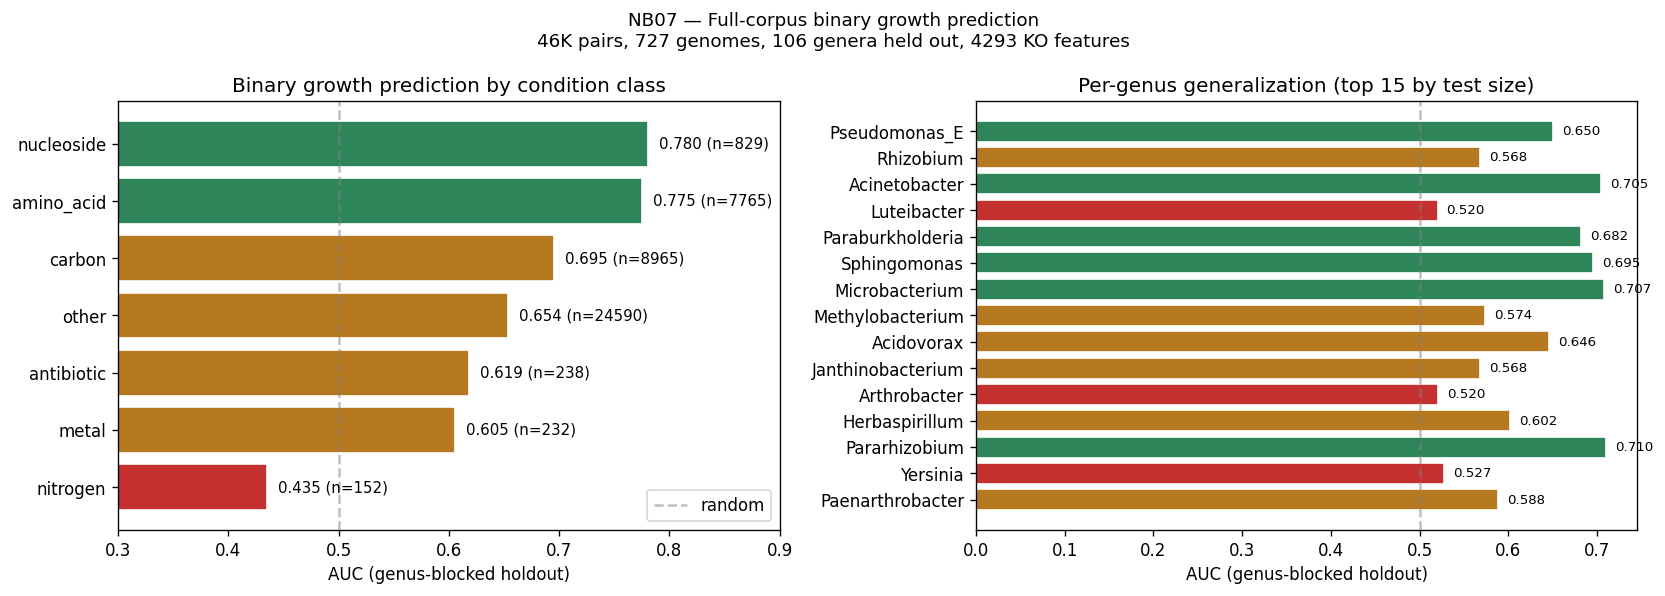
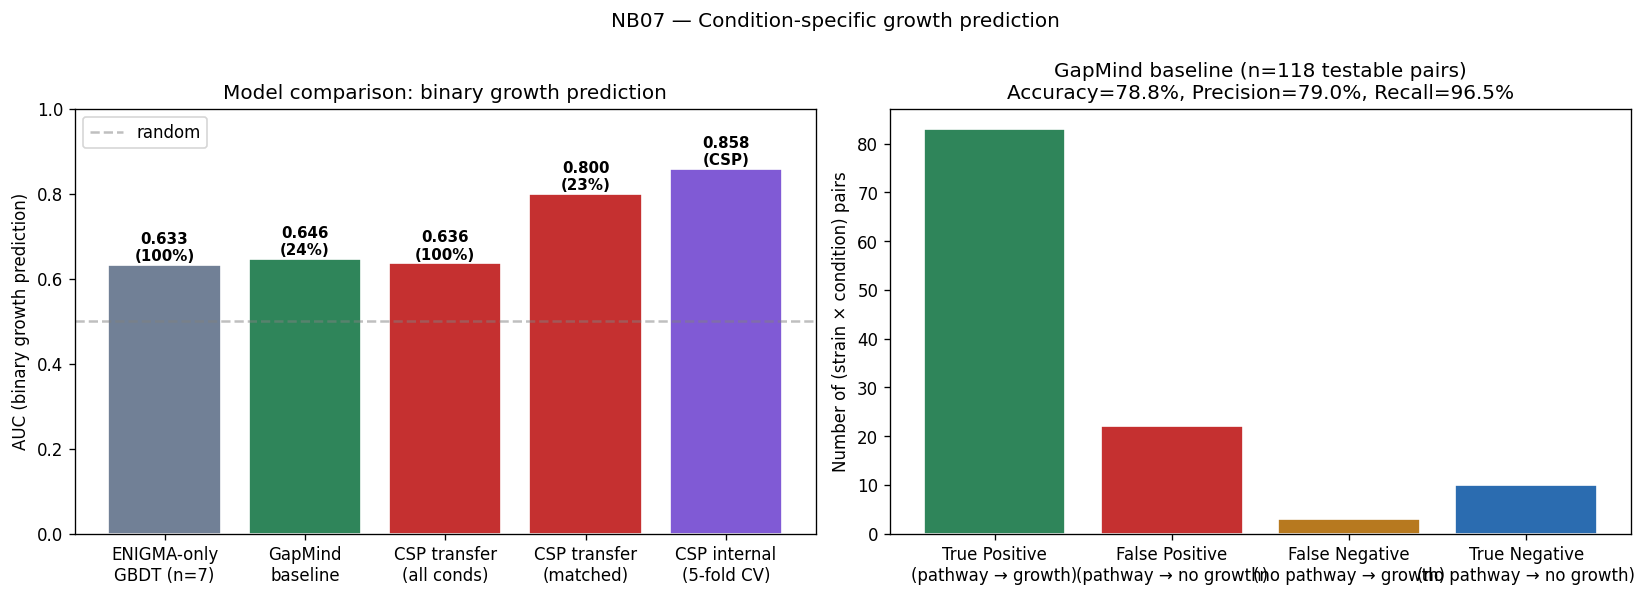
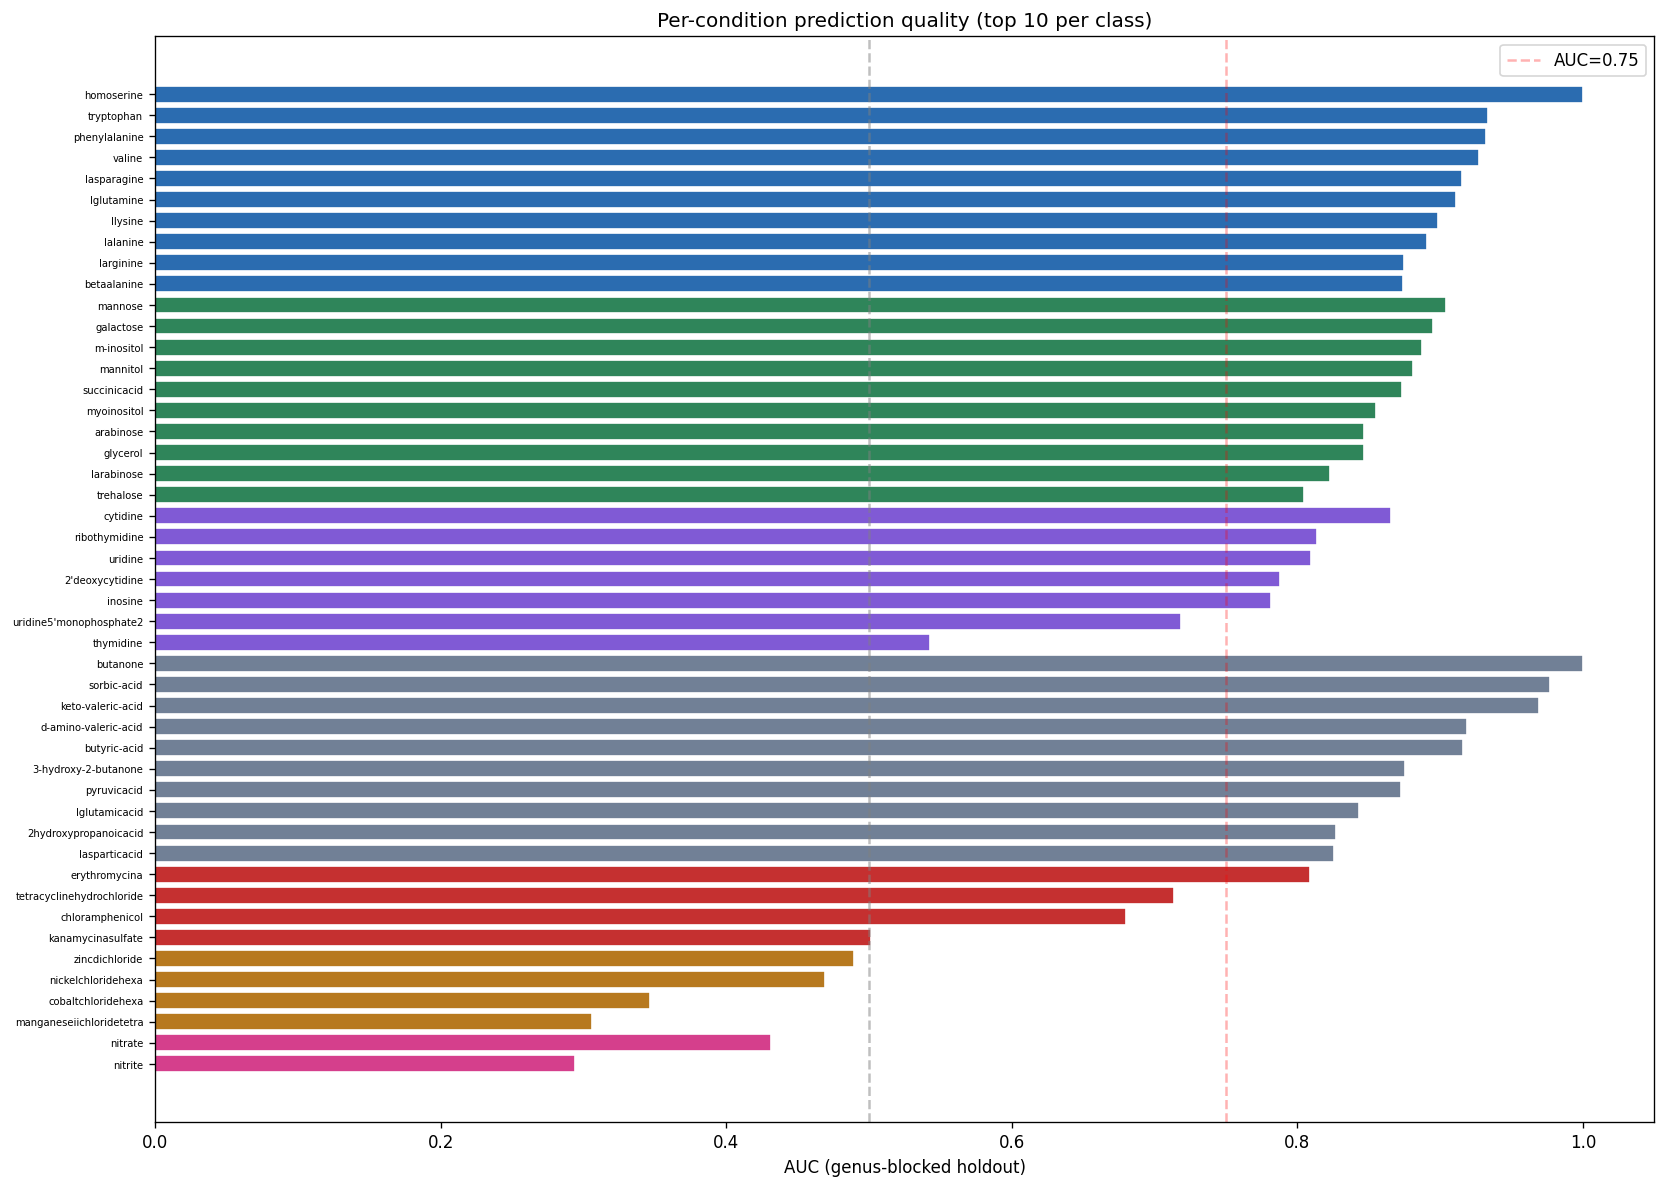
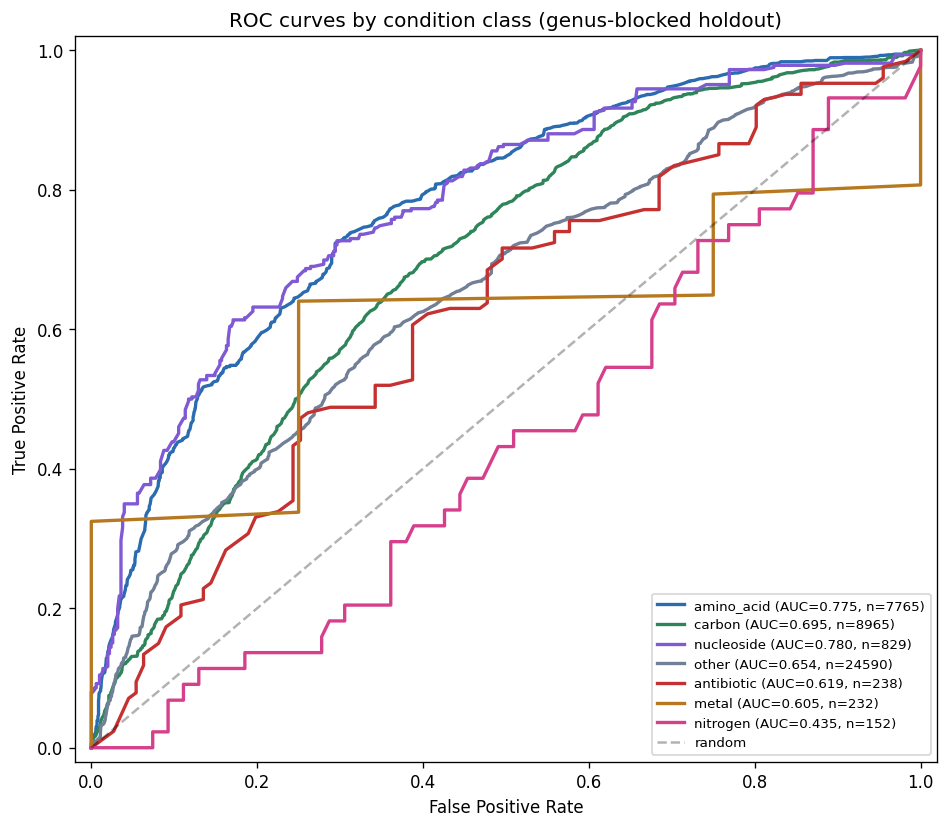
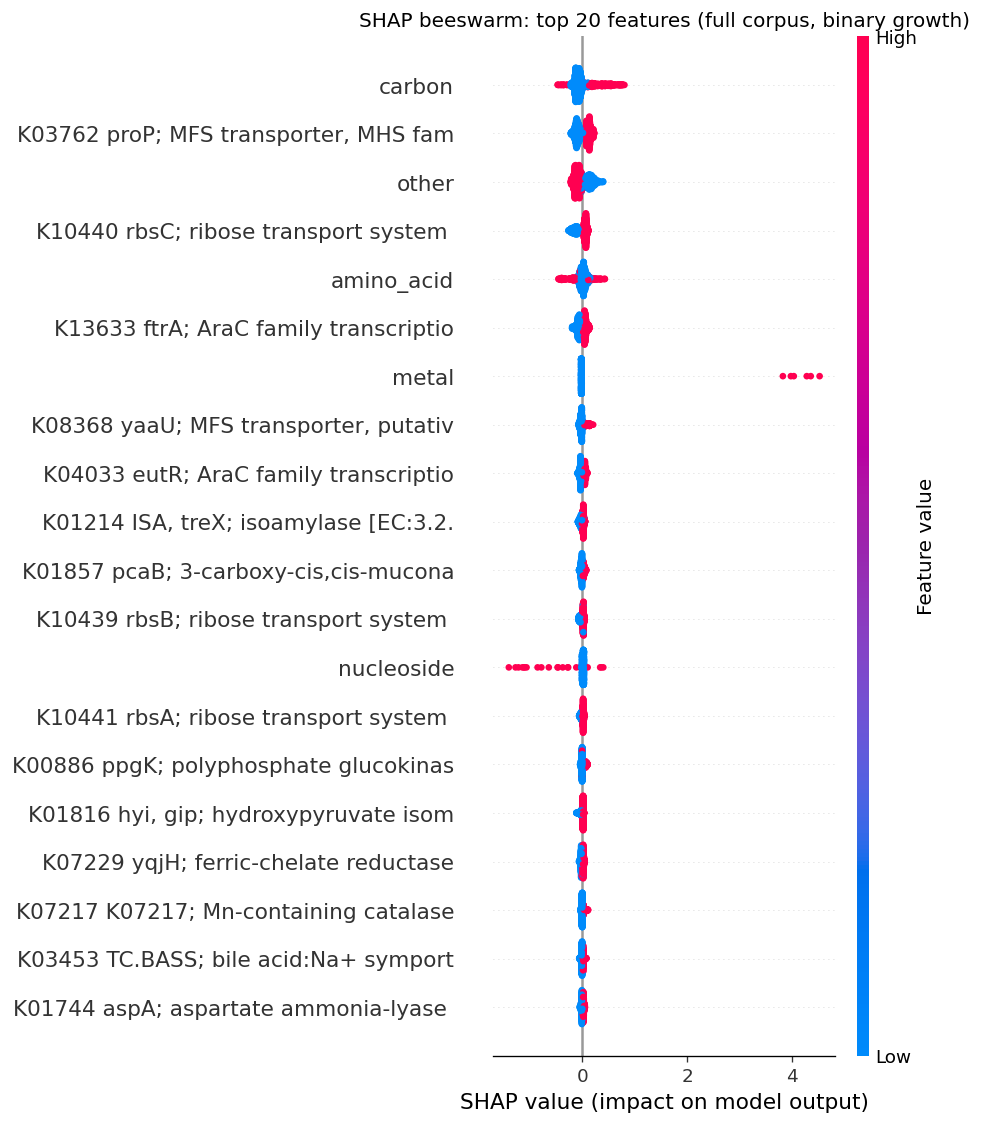
The project's conclusions are well-supported by comprehensive data analysis and appropriately acknowledge both successes and limitations. The central finding that binary growth on amino acids (AUC 0.775) and nucleosides (0.780) is predictable from KO content while continuous parameters (µmax, lag, yield) are not represents a genuine biological insight supported by 46K training pairs across 106 genera.
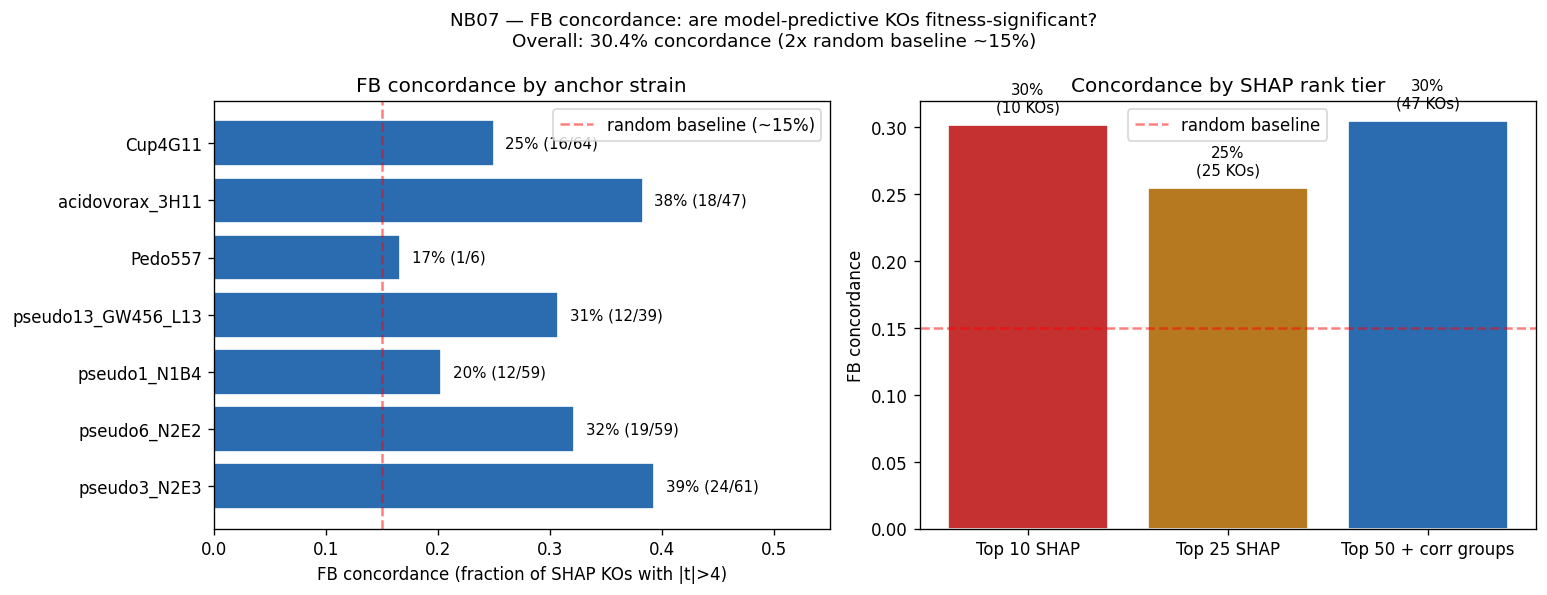
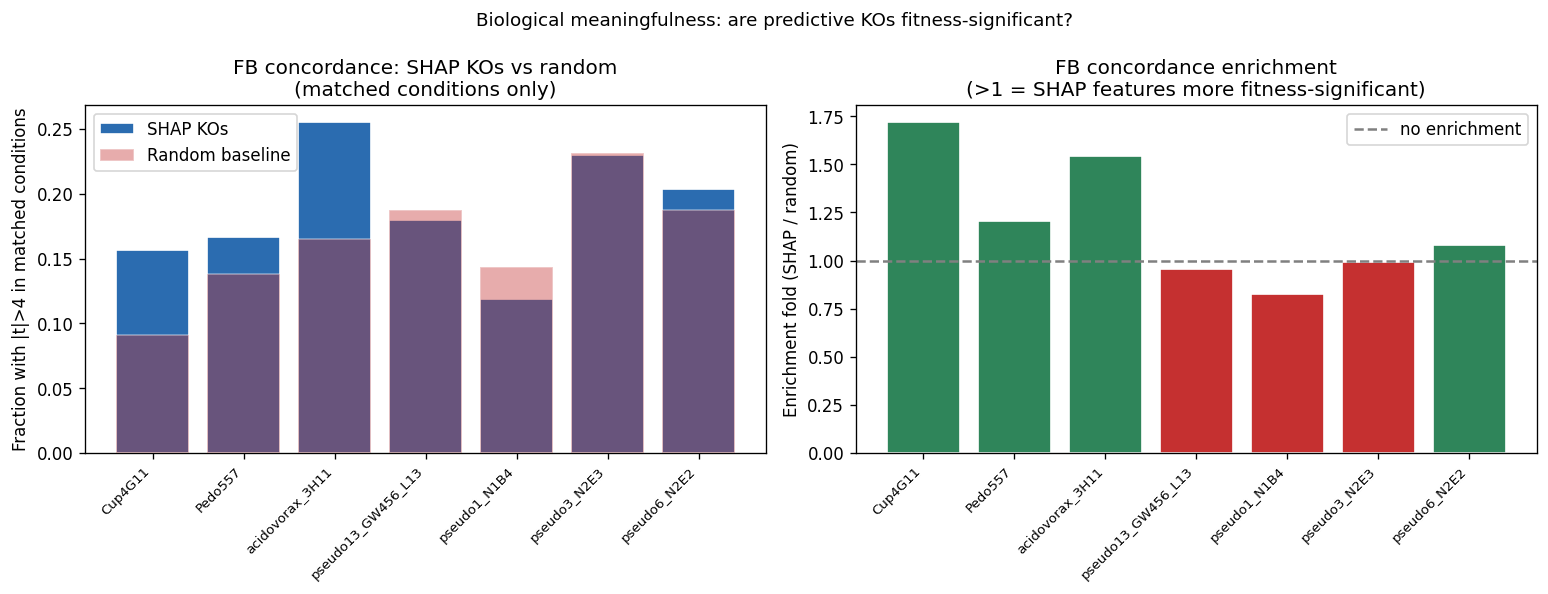
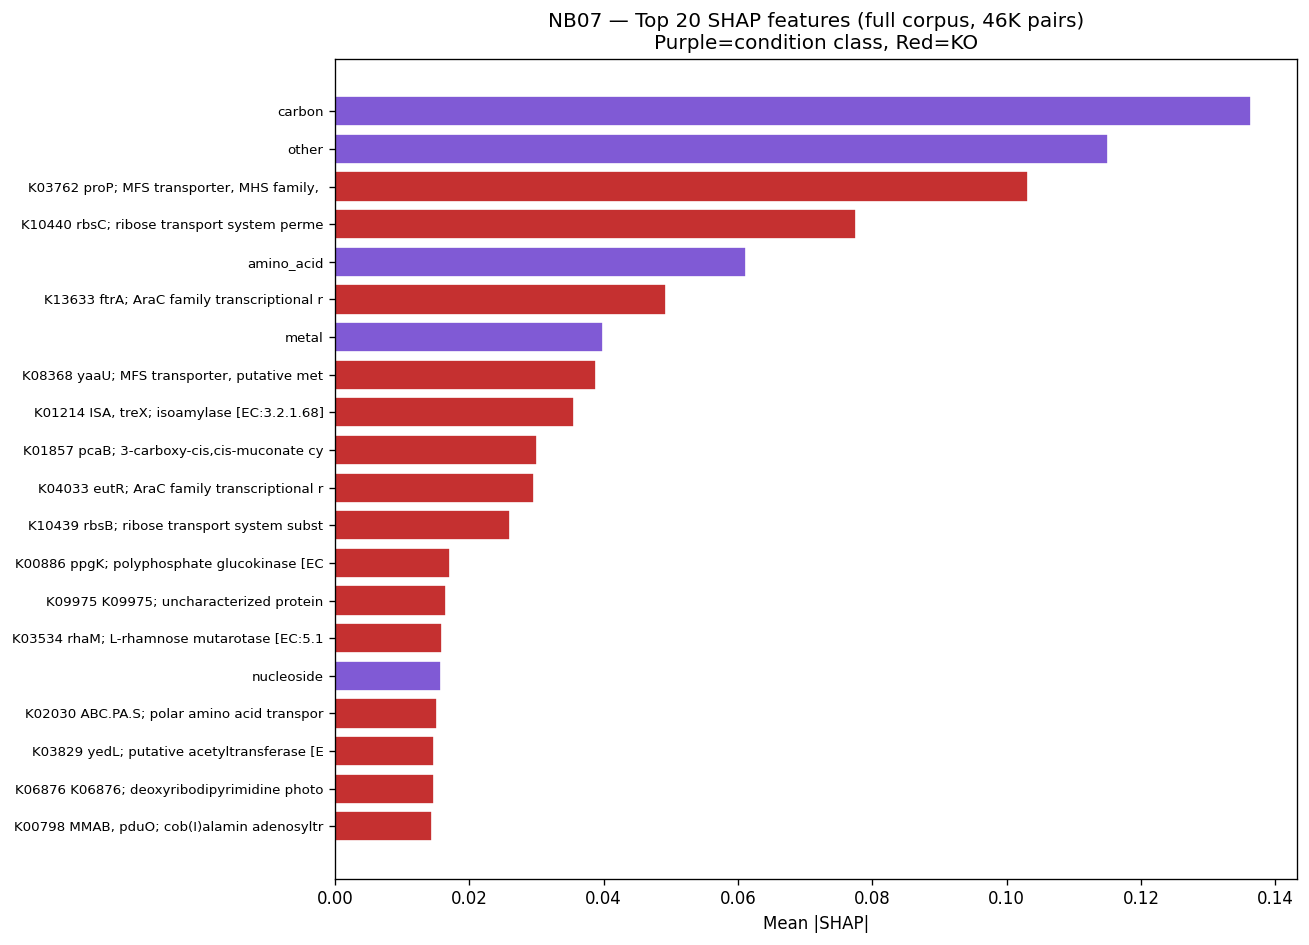
The mechanistic interpretability of features is demonstrated through SHAP analysis identifying condition-specific catabolic genes (ribose transporter predicting ribose growth, protocatechuate cycloisomerase predicting aromatic catabolism). However, the project honestly reports weak Fitness Browser concordance (1.19× enrichment), correctly interpreting this as reflecting different biological questions (gene presence across genera vs. gene essentiality within strains) rather than invalidating the approach.
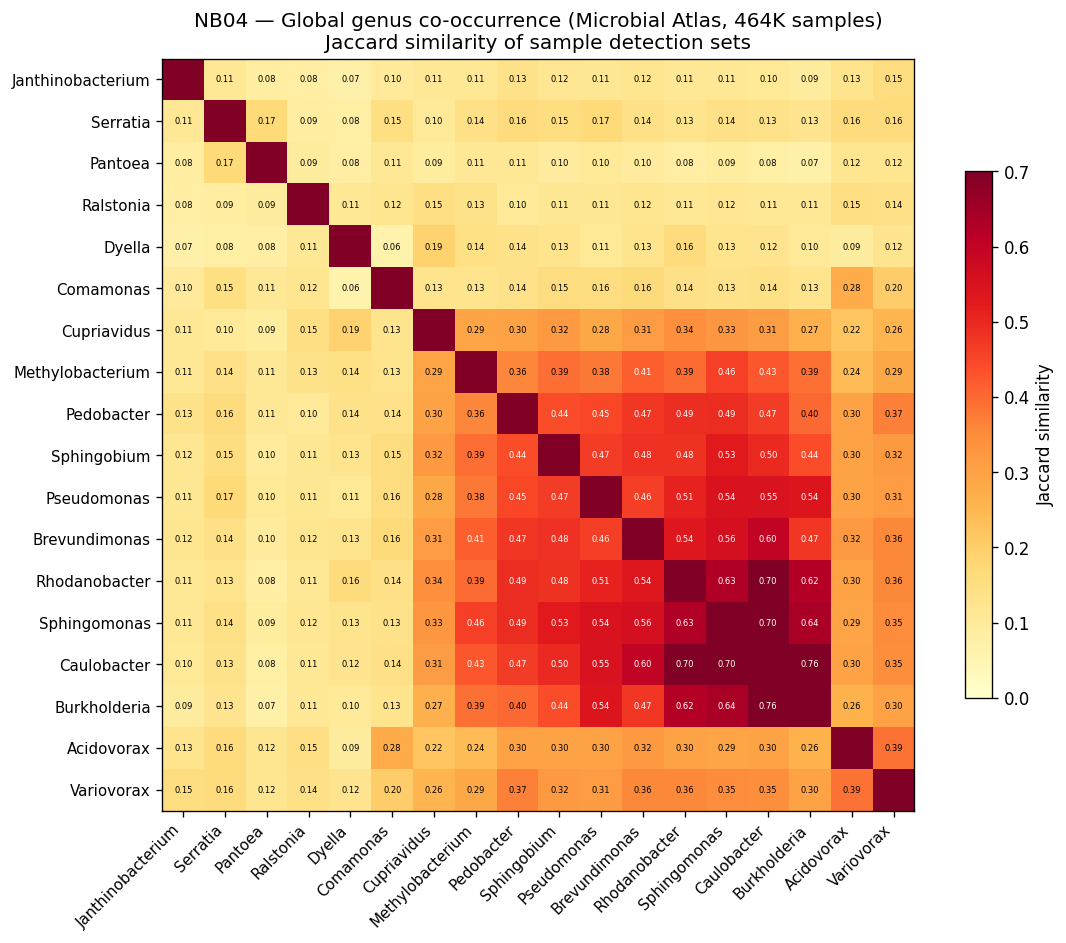
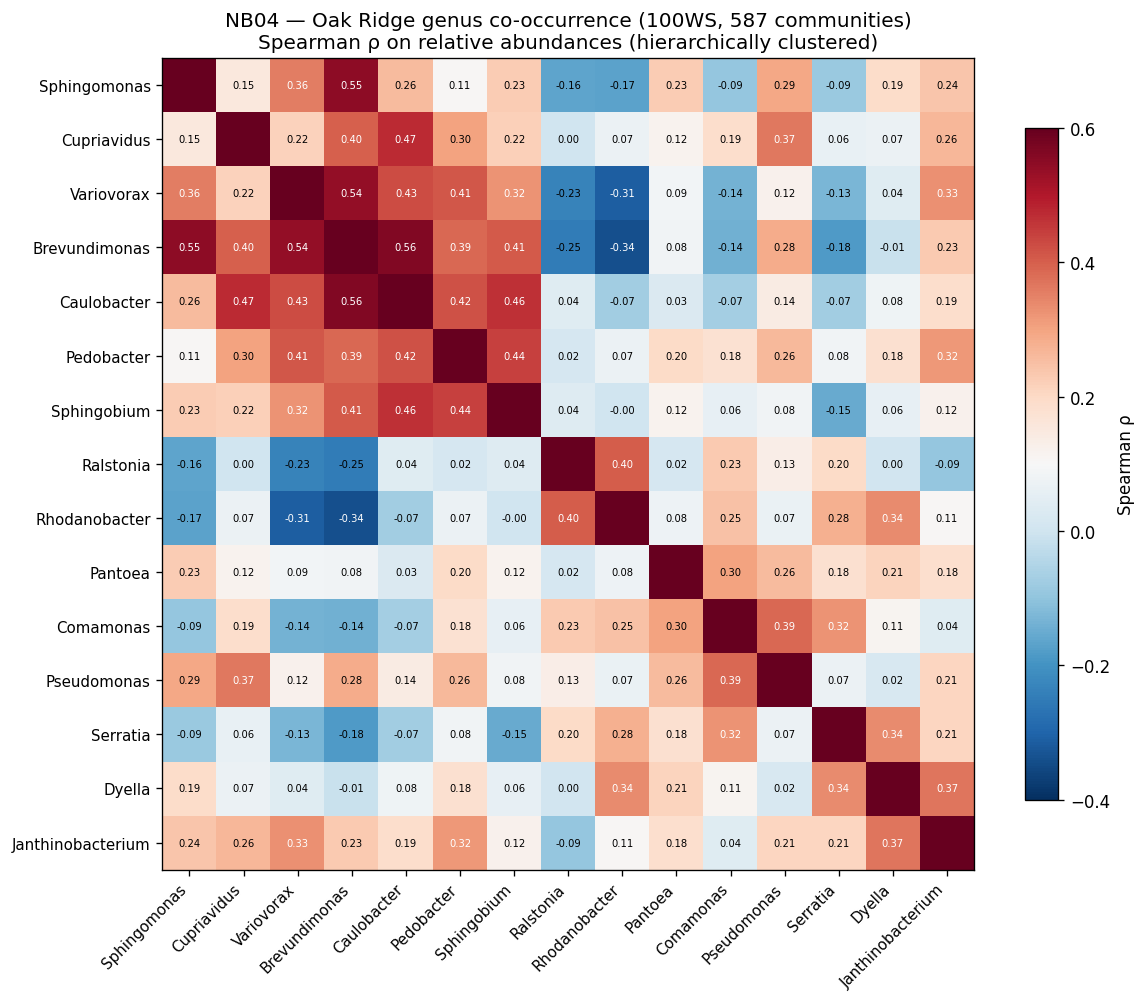
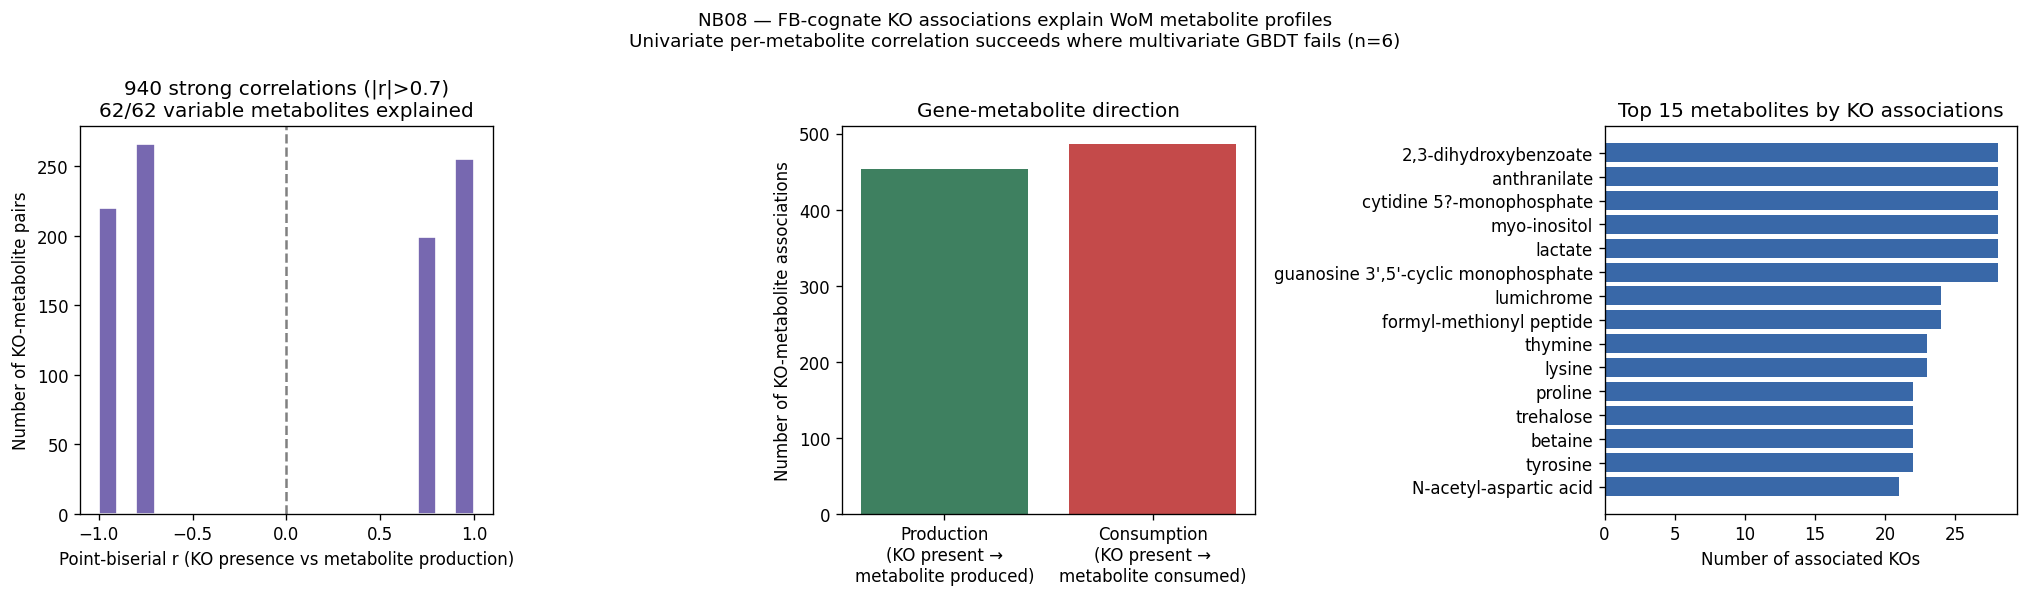
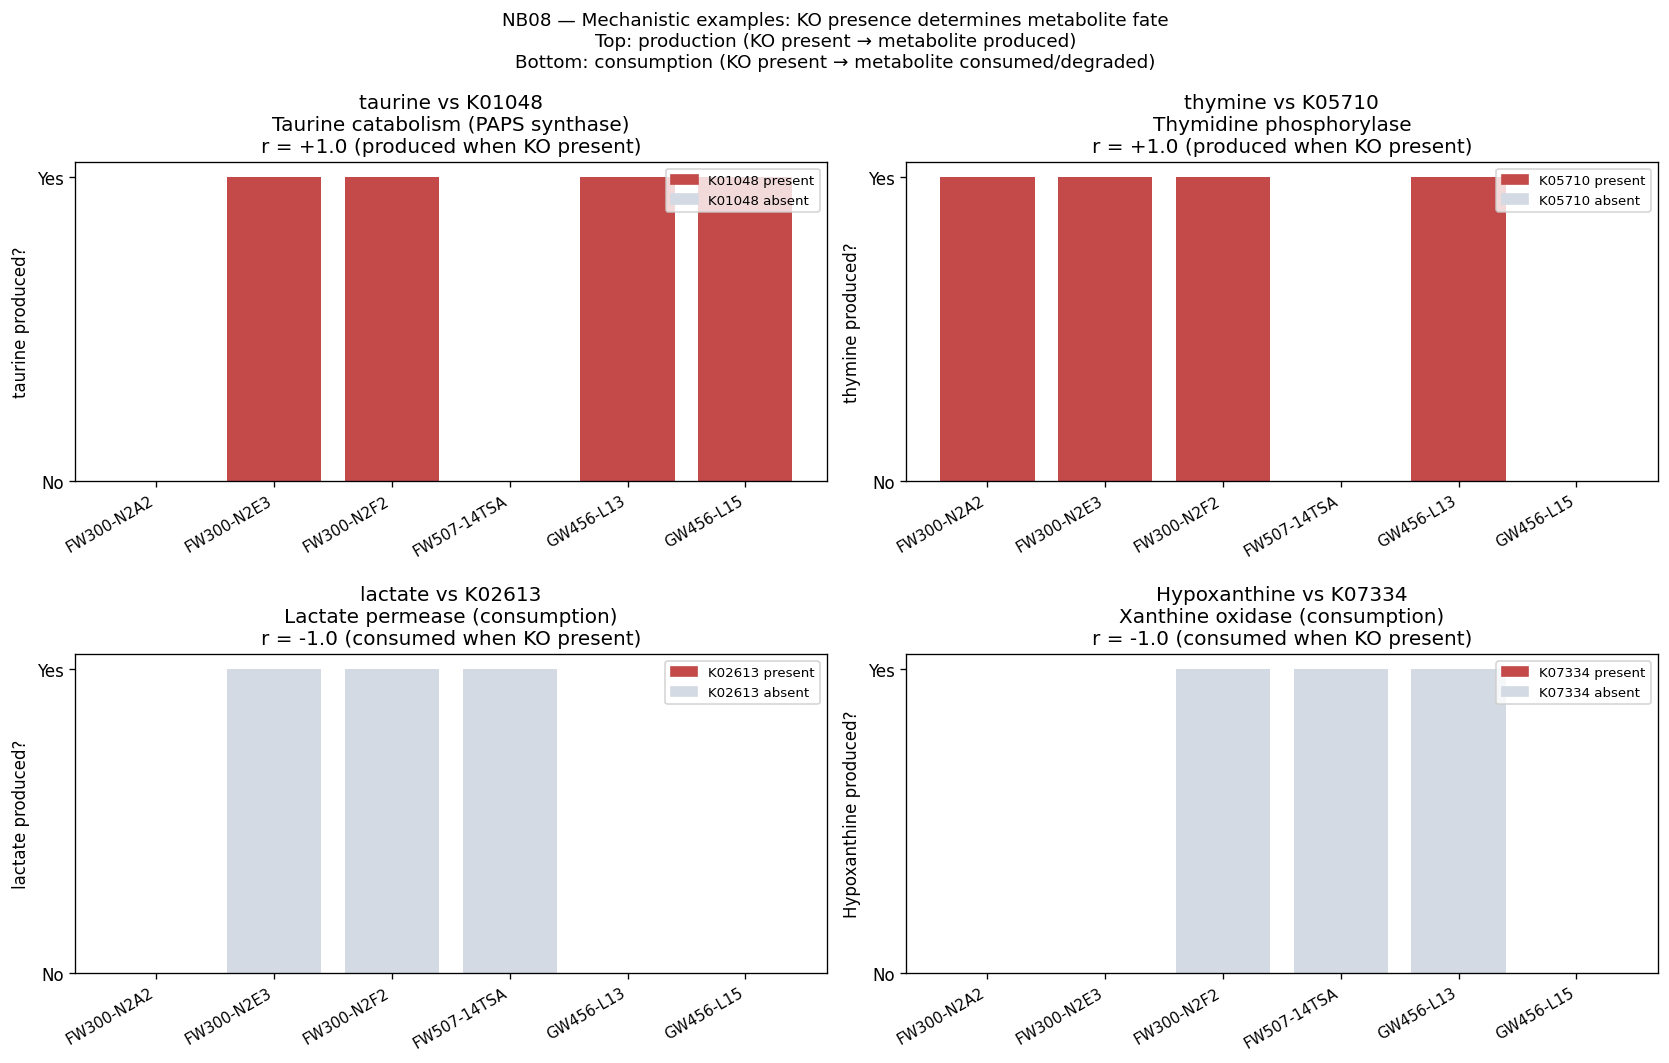
The global pH-driven niche partition connecting local Oak Ridge co-occurrence to 464K worldwide samples represents an unexpected and significant ecological finding, demonstrating how local contamination patterns reflect global microbial biogeography. The exometabolomic analysis successfully recovers 940 mechanistic gene-metabolite associations despite multivariate model failure at n=6, illustrating the importance of method selection for sample size.
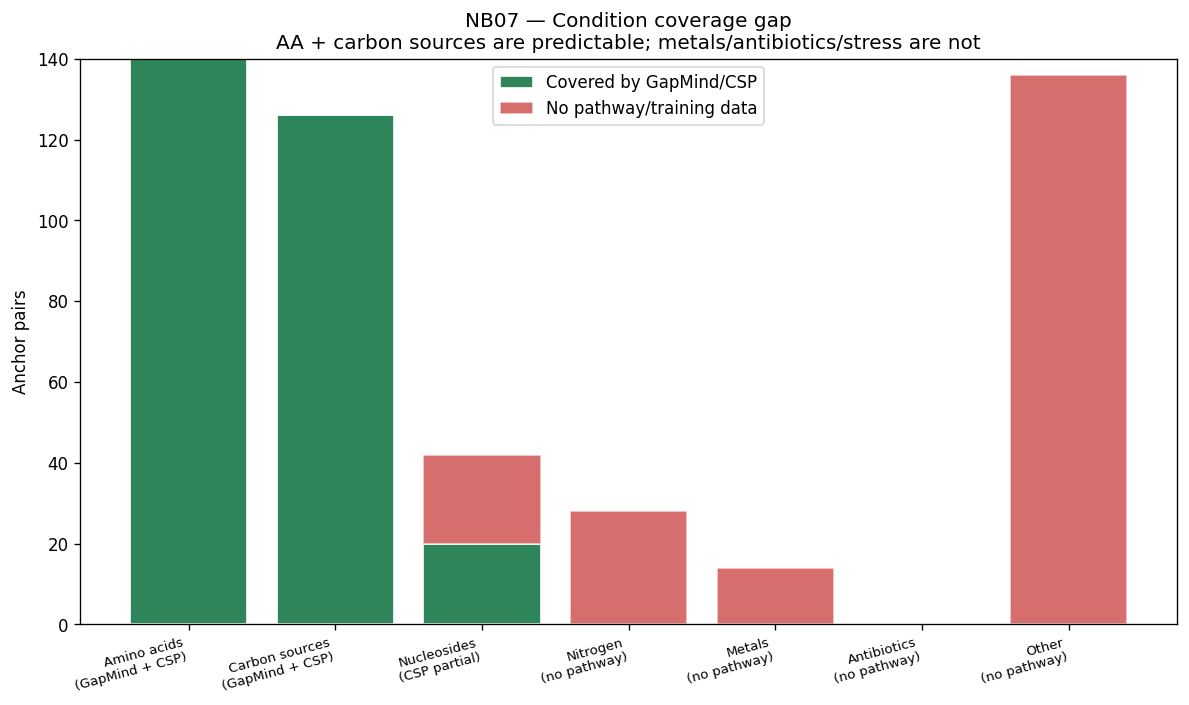
Limitations are appropriately acknowledged: condition alignment remains string-based rather than ChEBI-ID based; continuous parameter prediction fails under cross-genus validation; and co-occurrence analysis represents correlation rather than causation. The project appropriately distinguishes between data limitations and fundamental biological constraints.
Suggestions
-
Complete ChEBI-ID canonicalization: The current 42 molecular matches via string normalization could expand to 60-80 via systematic ChEBI ID resolution using the
sys_oterm_idfield in growth curve bricks, potentially strengthening cross-dataset validation. -
Implement formal active learning validation: While the 50-experiment ranking framework is in place, retrospective subsampling (AL-ranked vs. random experiment selection) would provide quantitative validation of the proposed approach.
-
Add codon usage bias features: The fundamental limitation in continuous parameter prediction could potentially be addressed by computing CUB metrics from nucleotide sequences, as suggested in the Xu et al. (2025) Phydon approach.
-
Expand FB concordance analysis: Consider KEGG-module-level expansion of SHAP features to distinguish "wrong feature, right pathway" from "wrong pathway" and potentially recover additional mechanistic signal.
-
Strengthen co-occurrence analysis: Apply SparCC (compositionally aware correlation) to the full 100WS ASV matrix rather than relying on Spearman correlation on genus-level data.
-
Document resource requirements: While runtime estimates are provided, memory requirements and recommended computing resources for full reproduction would help future users.
-
Consider validation dataset expansion: The relatively small FB anchor set (7 strains) could potentially be expanded through additional strain-organism matching to strengthen biological validation.
This review was generated by an AI system. It should be treated as advisory input, not a definitive assessment.
Visualizations
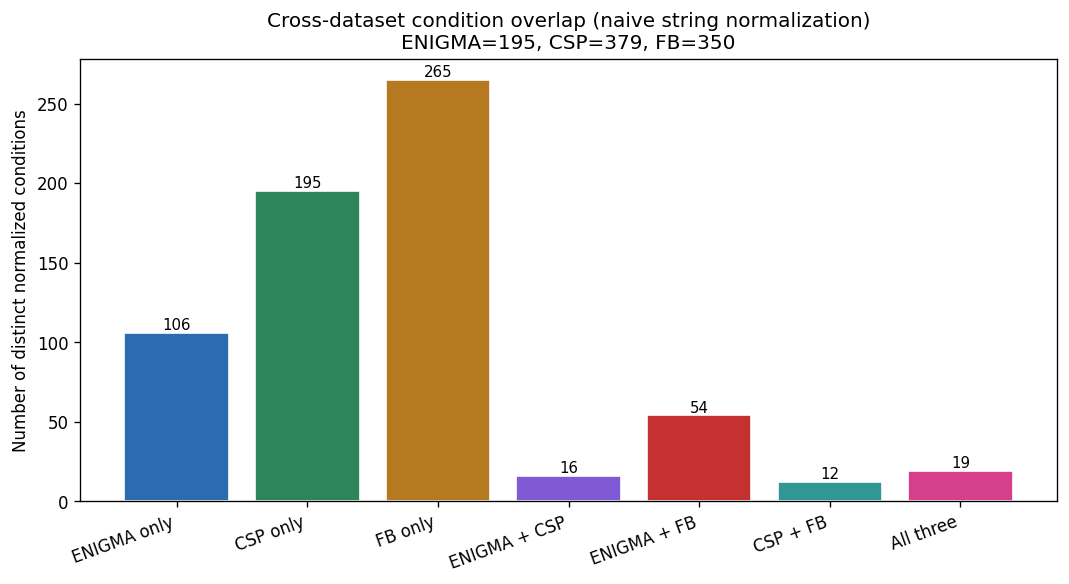
Nb00 Condition Overlap
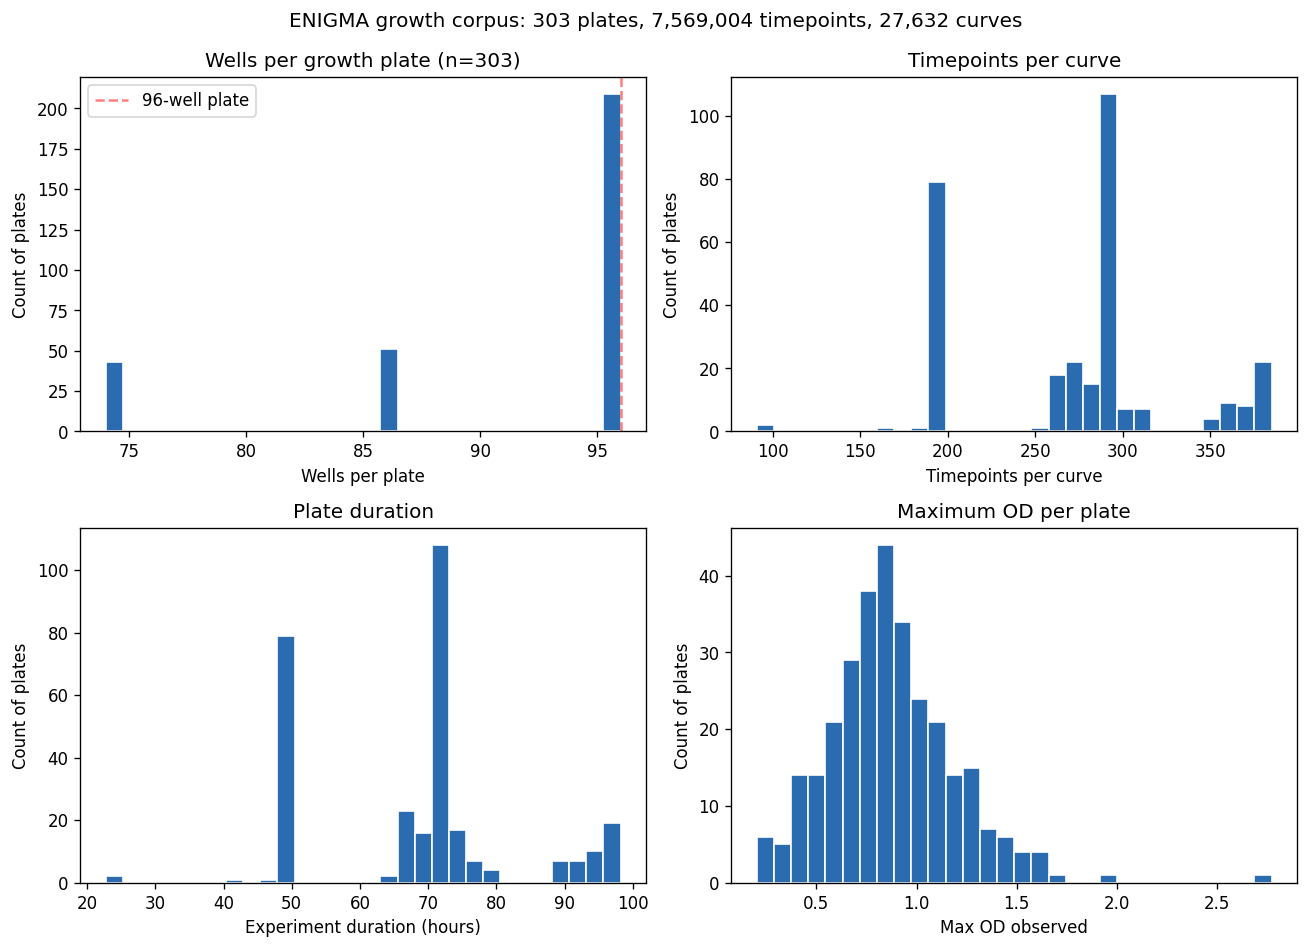
Nb00 Growth Corpus Stats
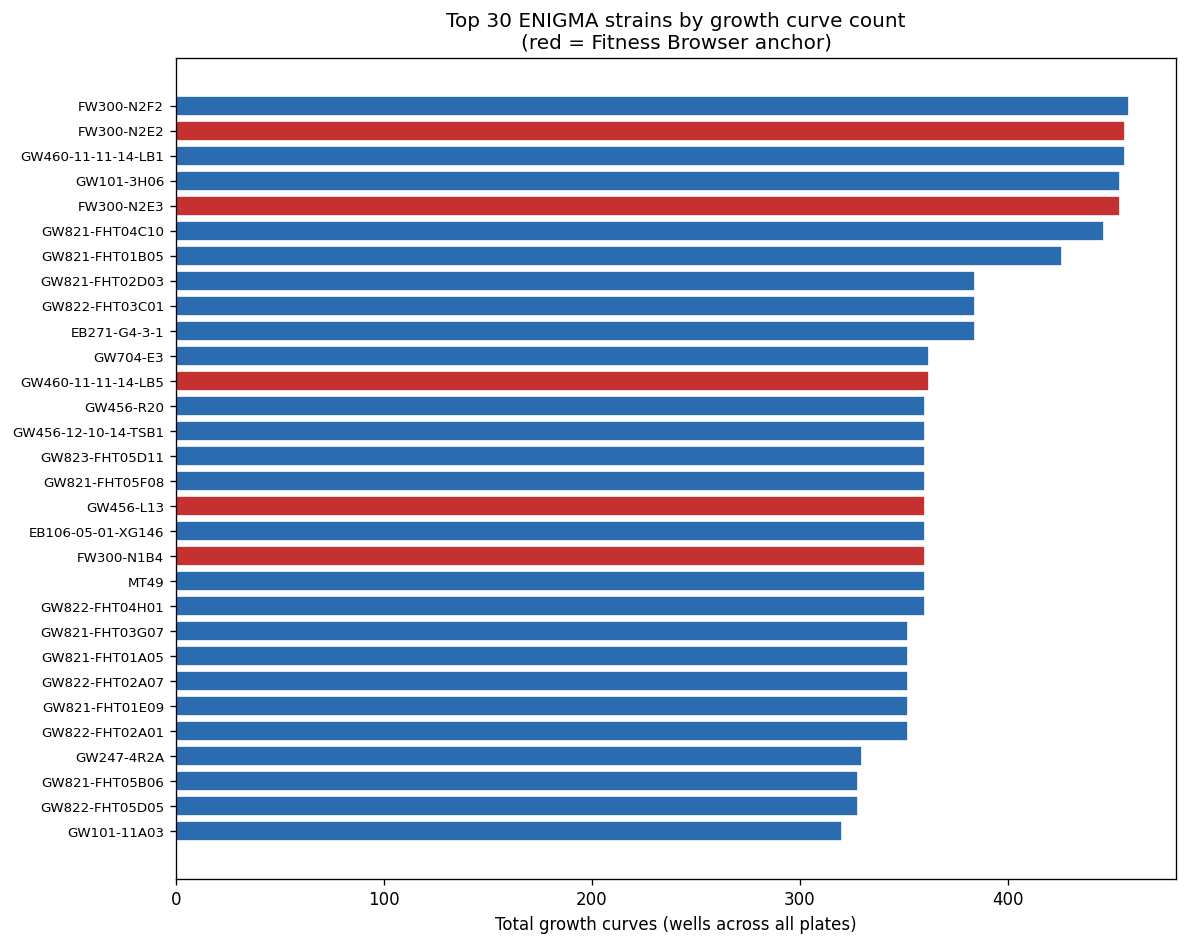
Nb00 Per Strain Curves
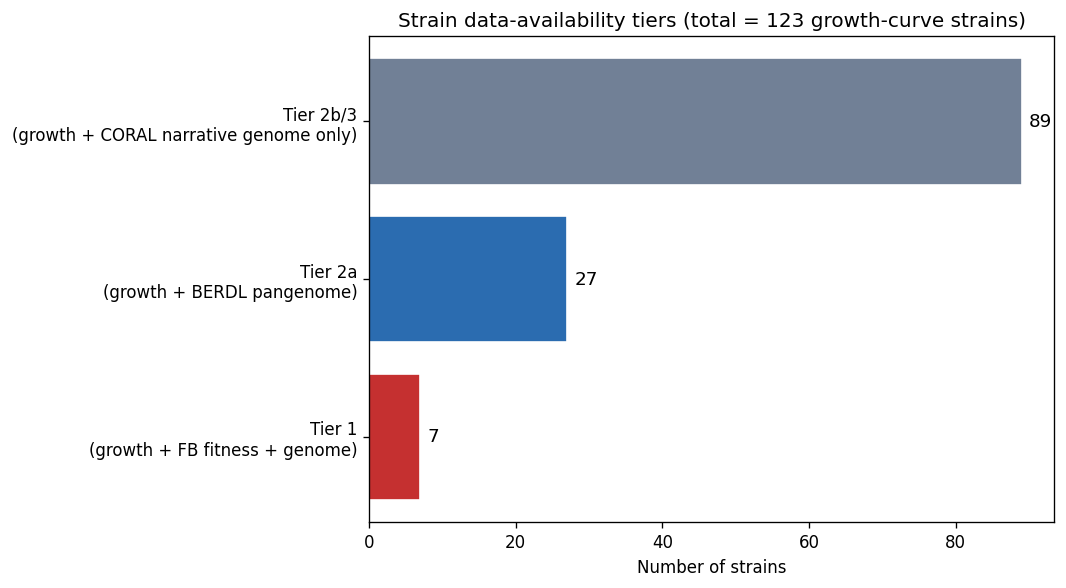
Nb00 Strain Tiers
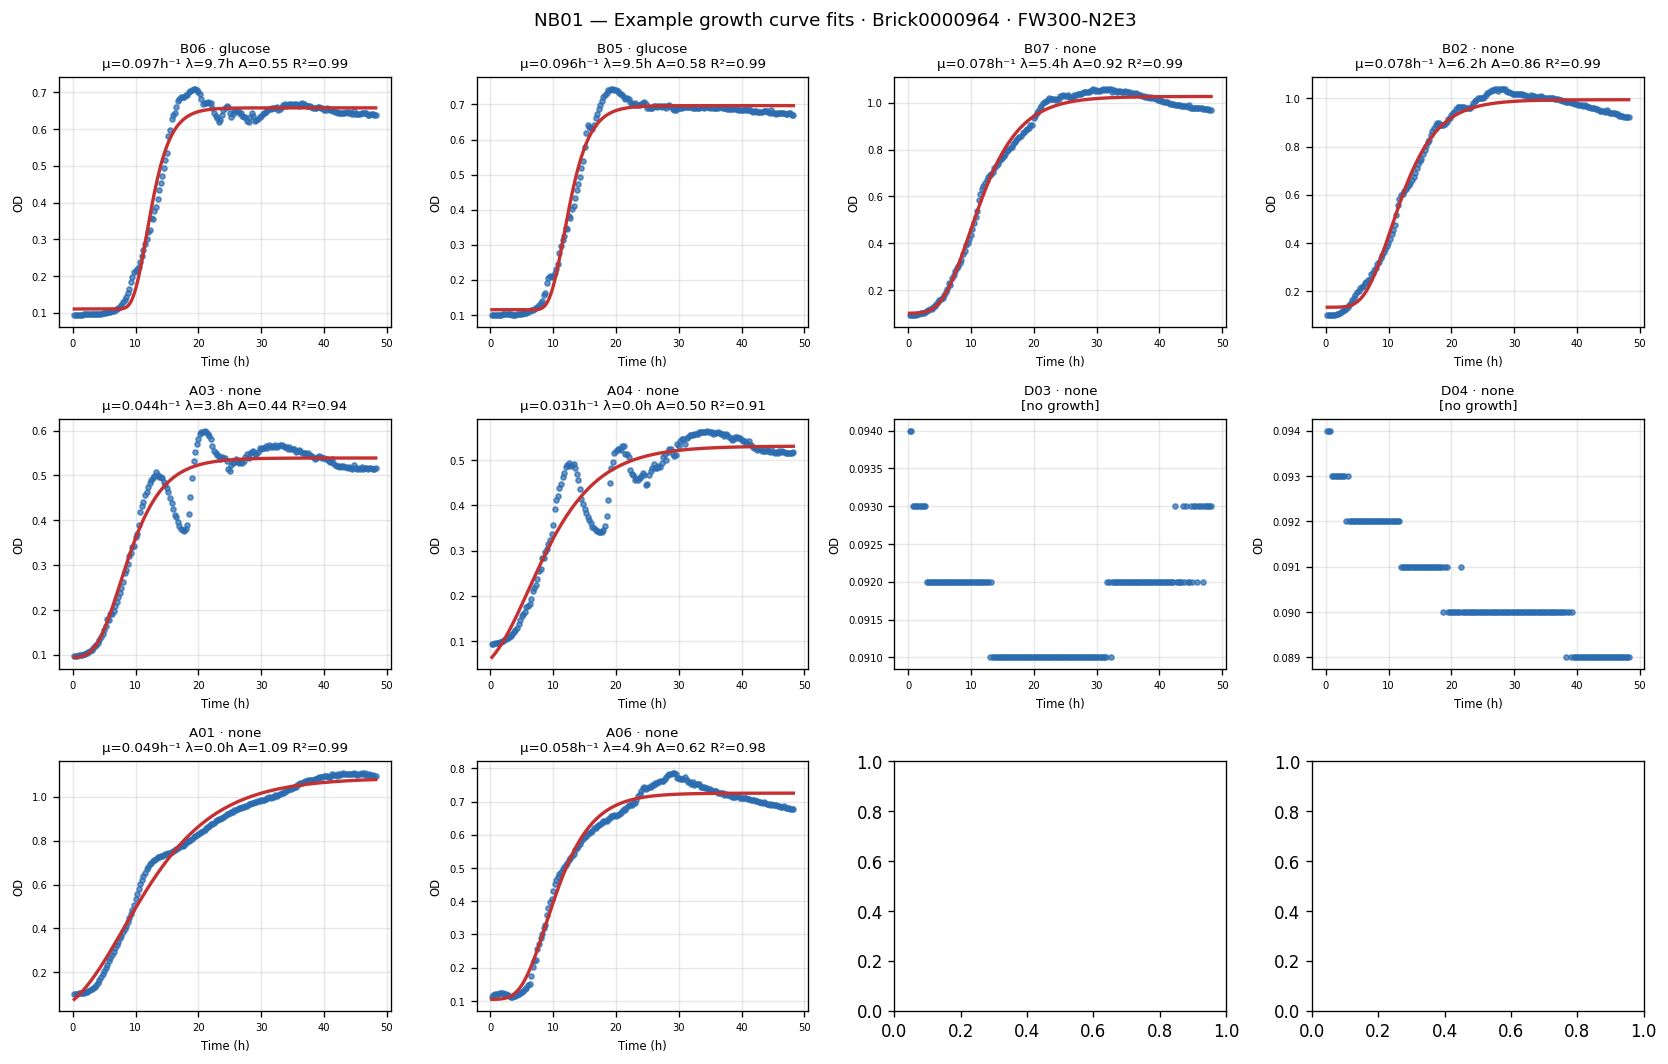
Nb01 Curve Fit Examples
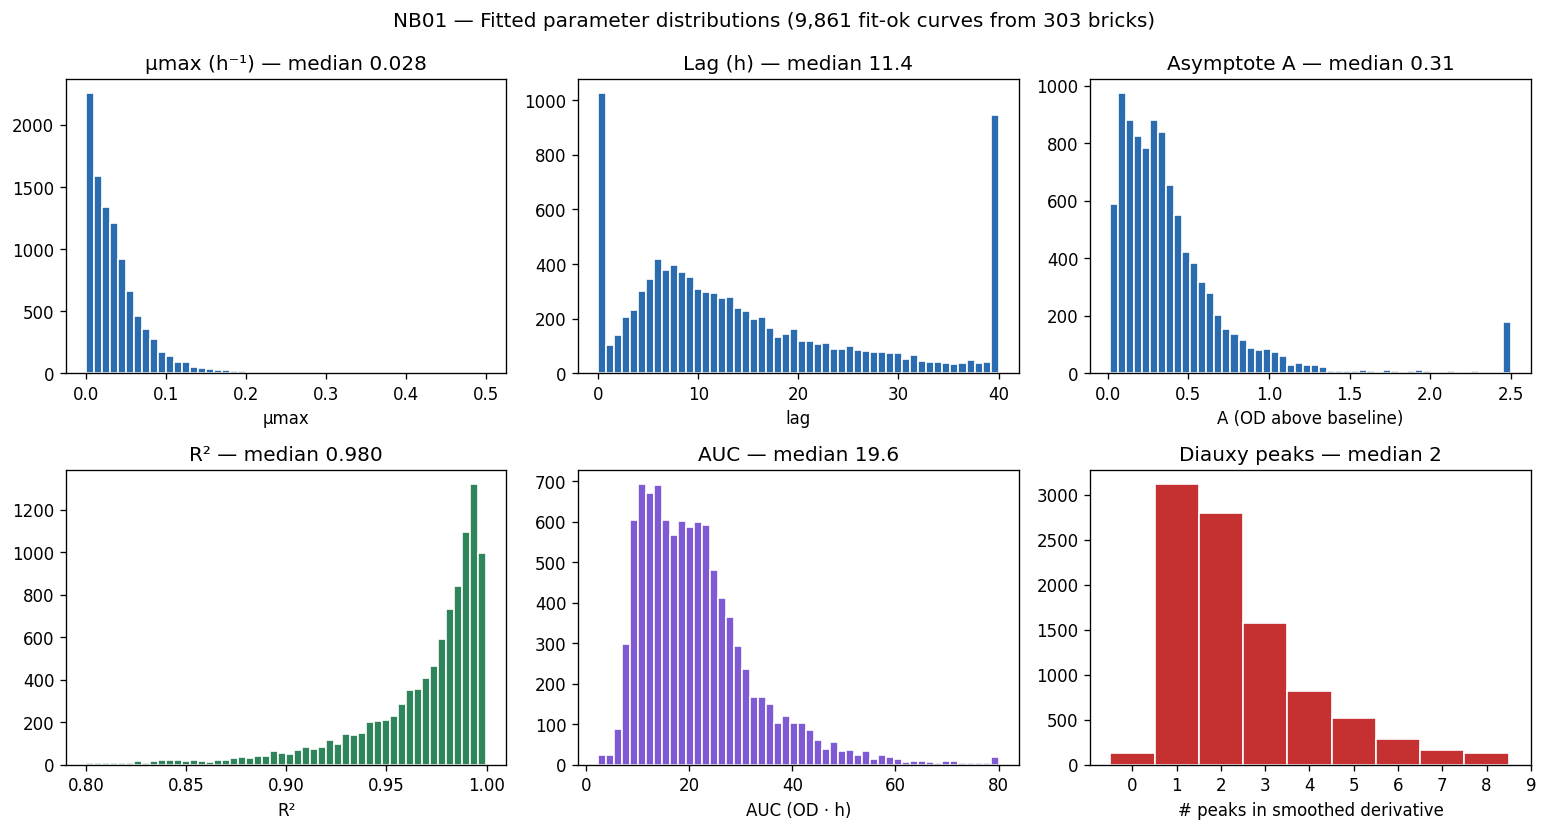
Nb01 Parameter Distributions
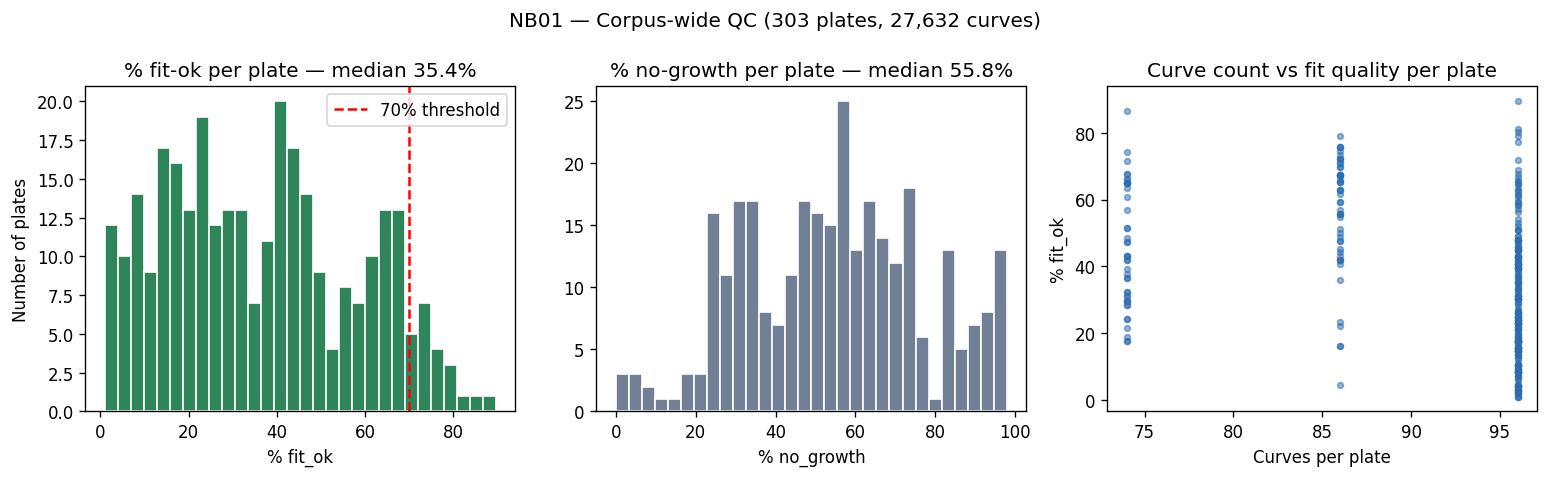
Nb01 Qc Summary
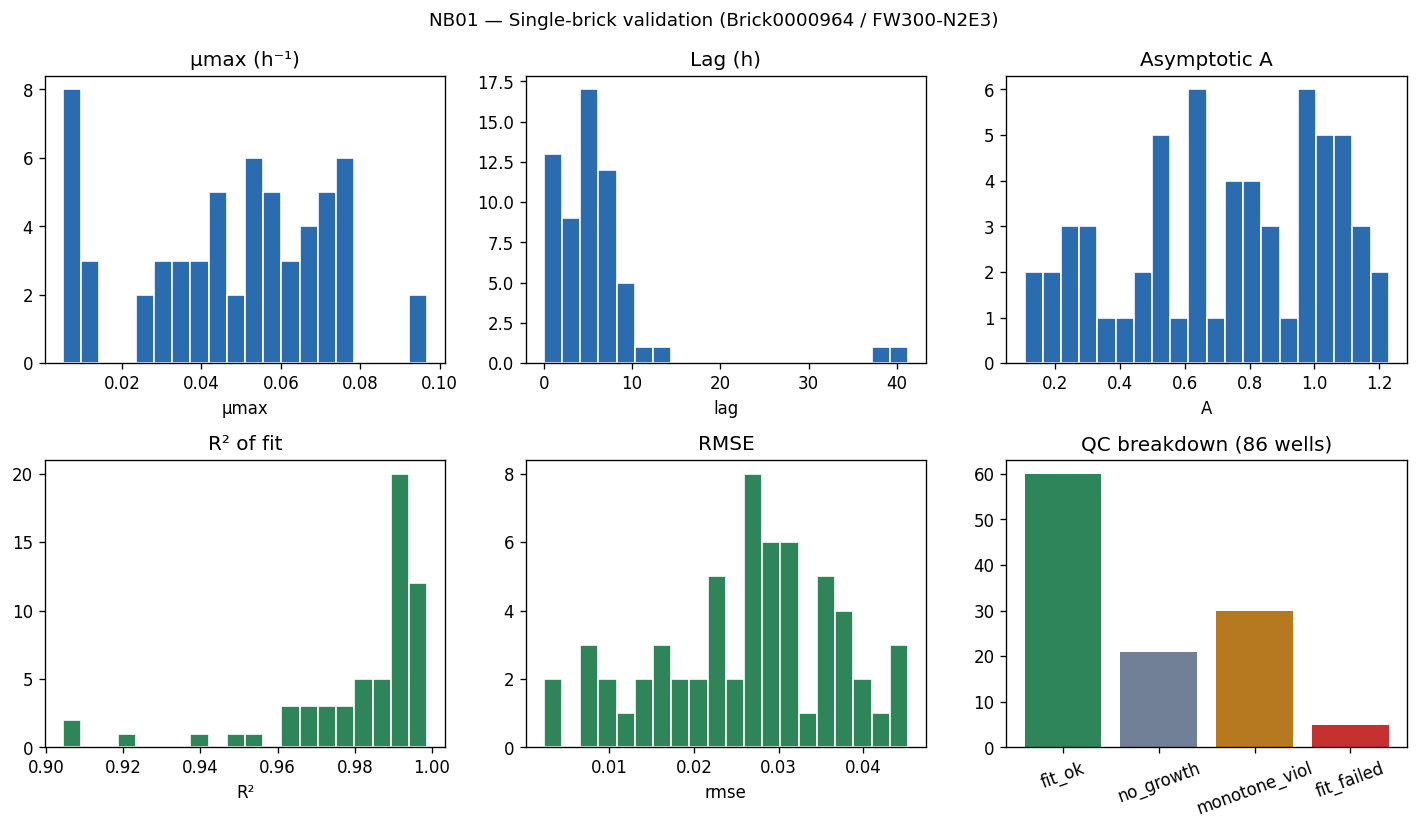
Nb01 Single Brick Qc
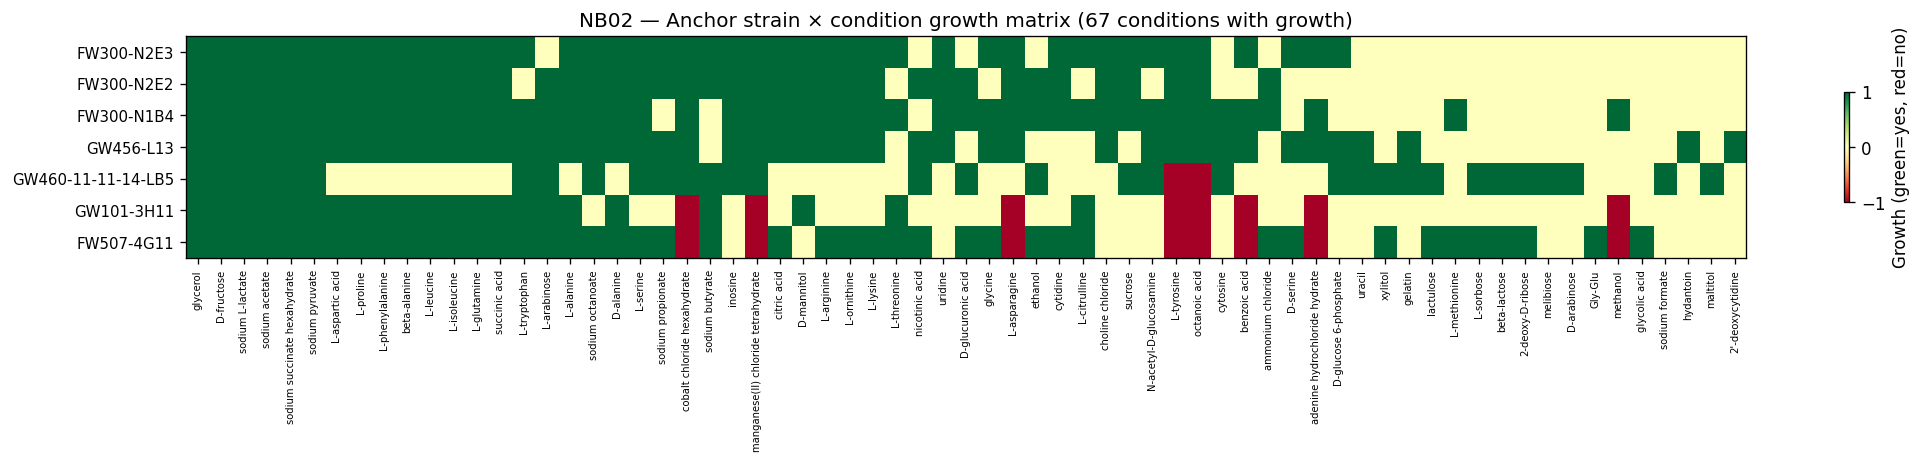
Nb02 Anchor Growth Heatmap
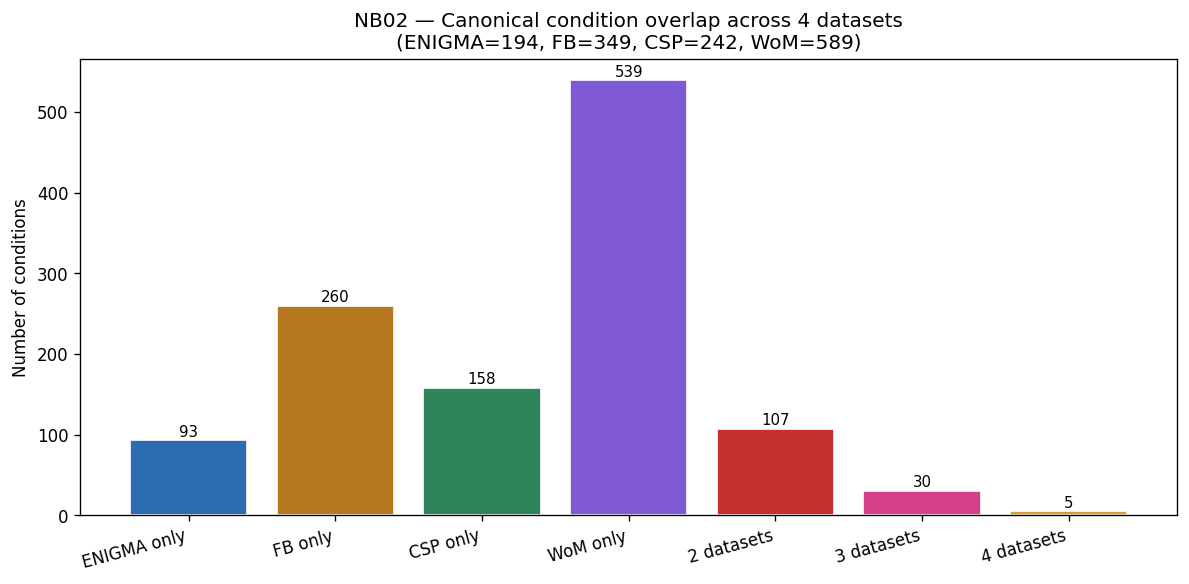
Nb02 Condition Overlap 4Way
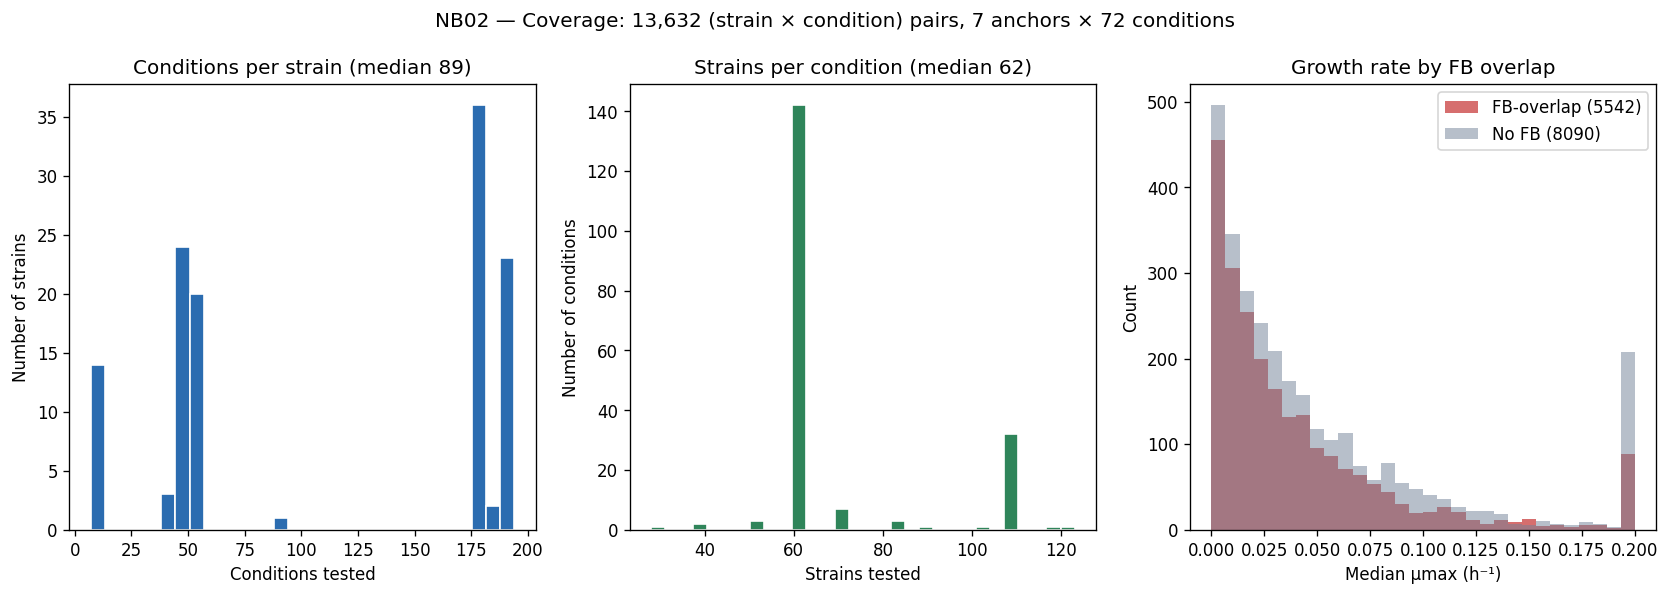
Nb02 Coverage Summary
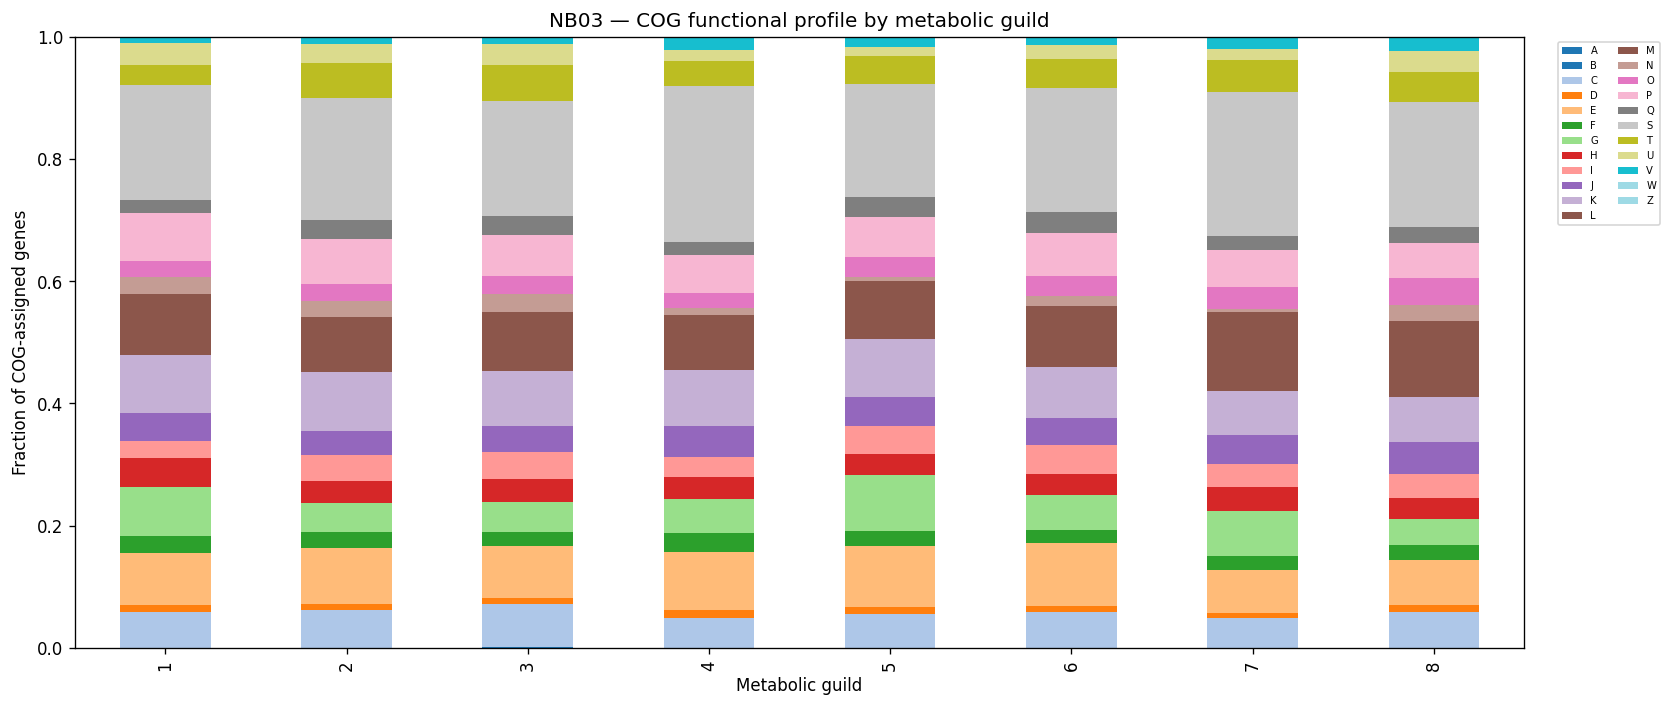
Nb03 Cog By Guild
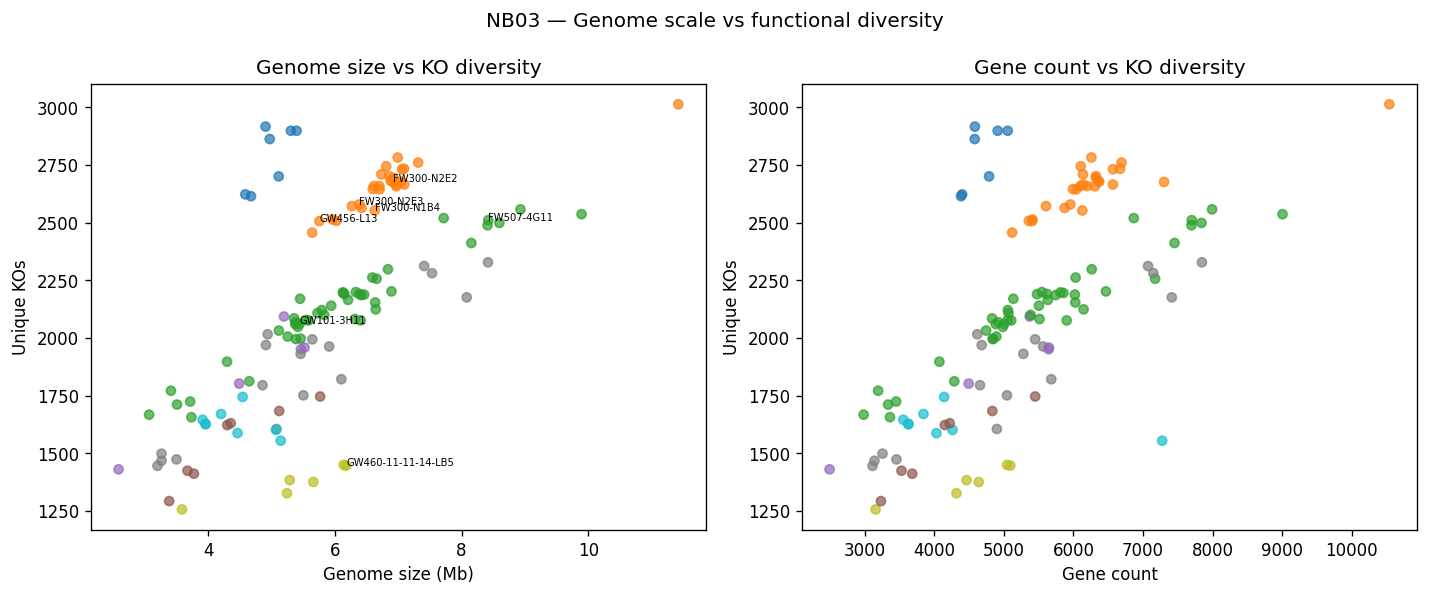
Nb03 Genome Vs Ko
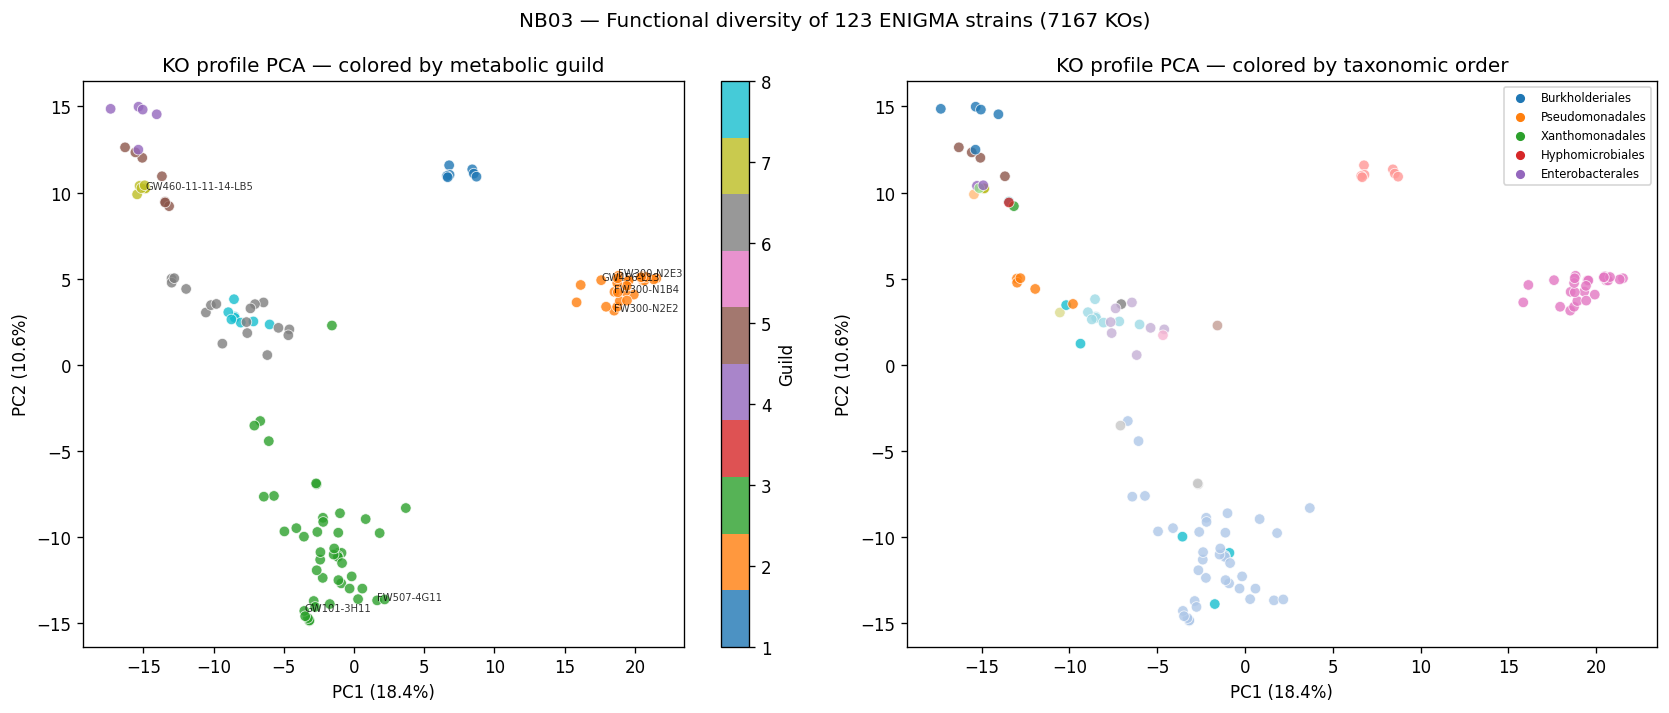
Nb03 Ko Pca Guilds
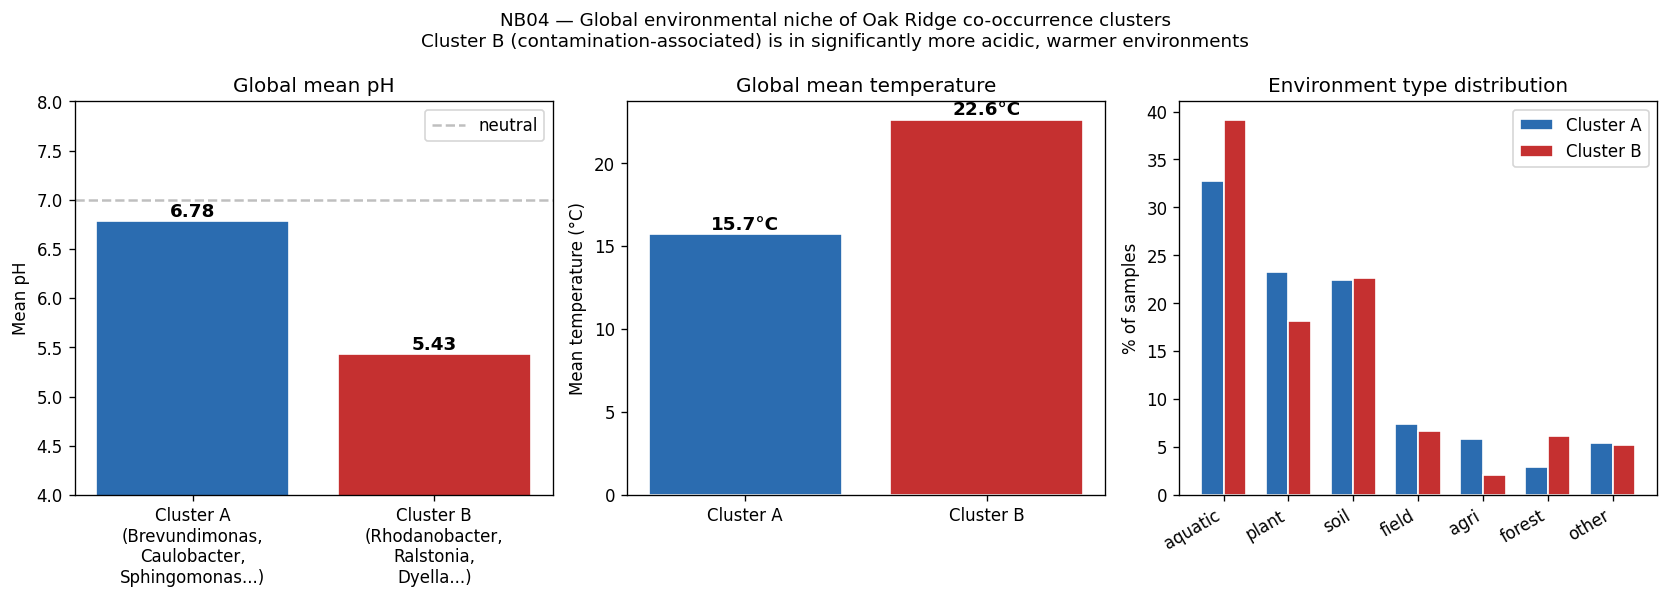
Nb04 Cluster Env Comparison
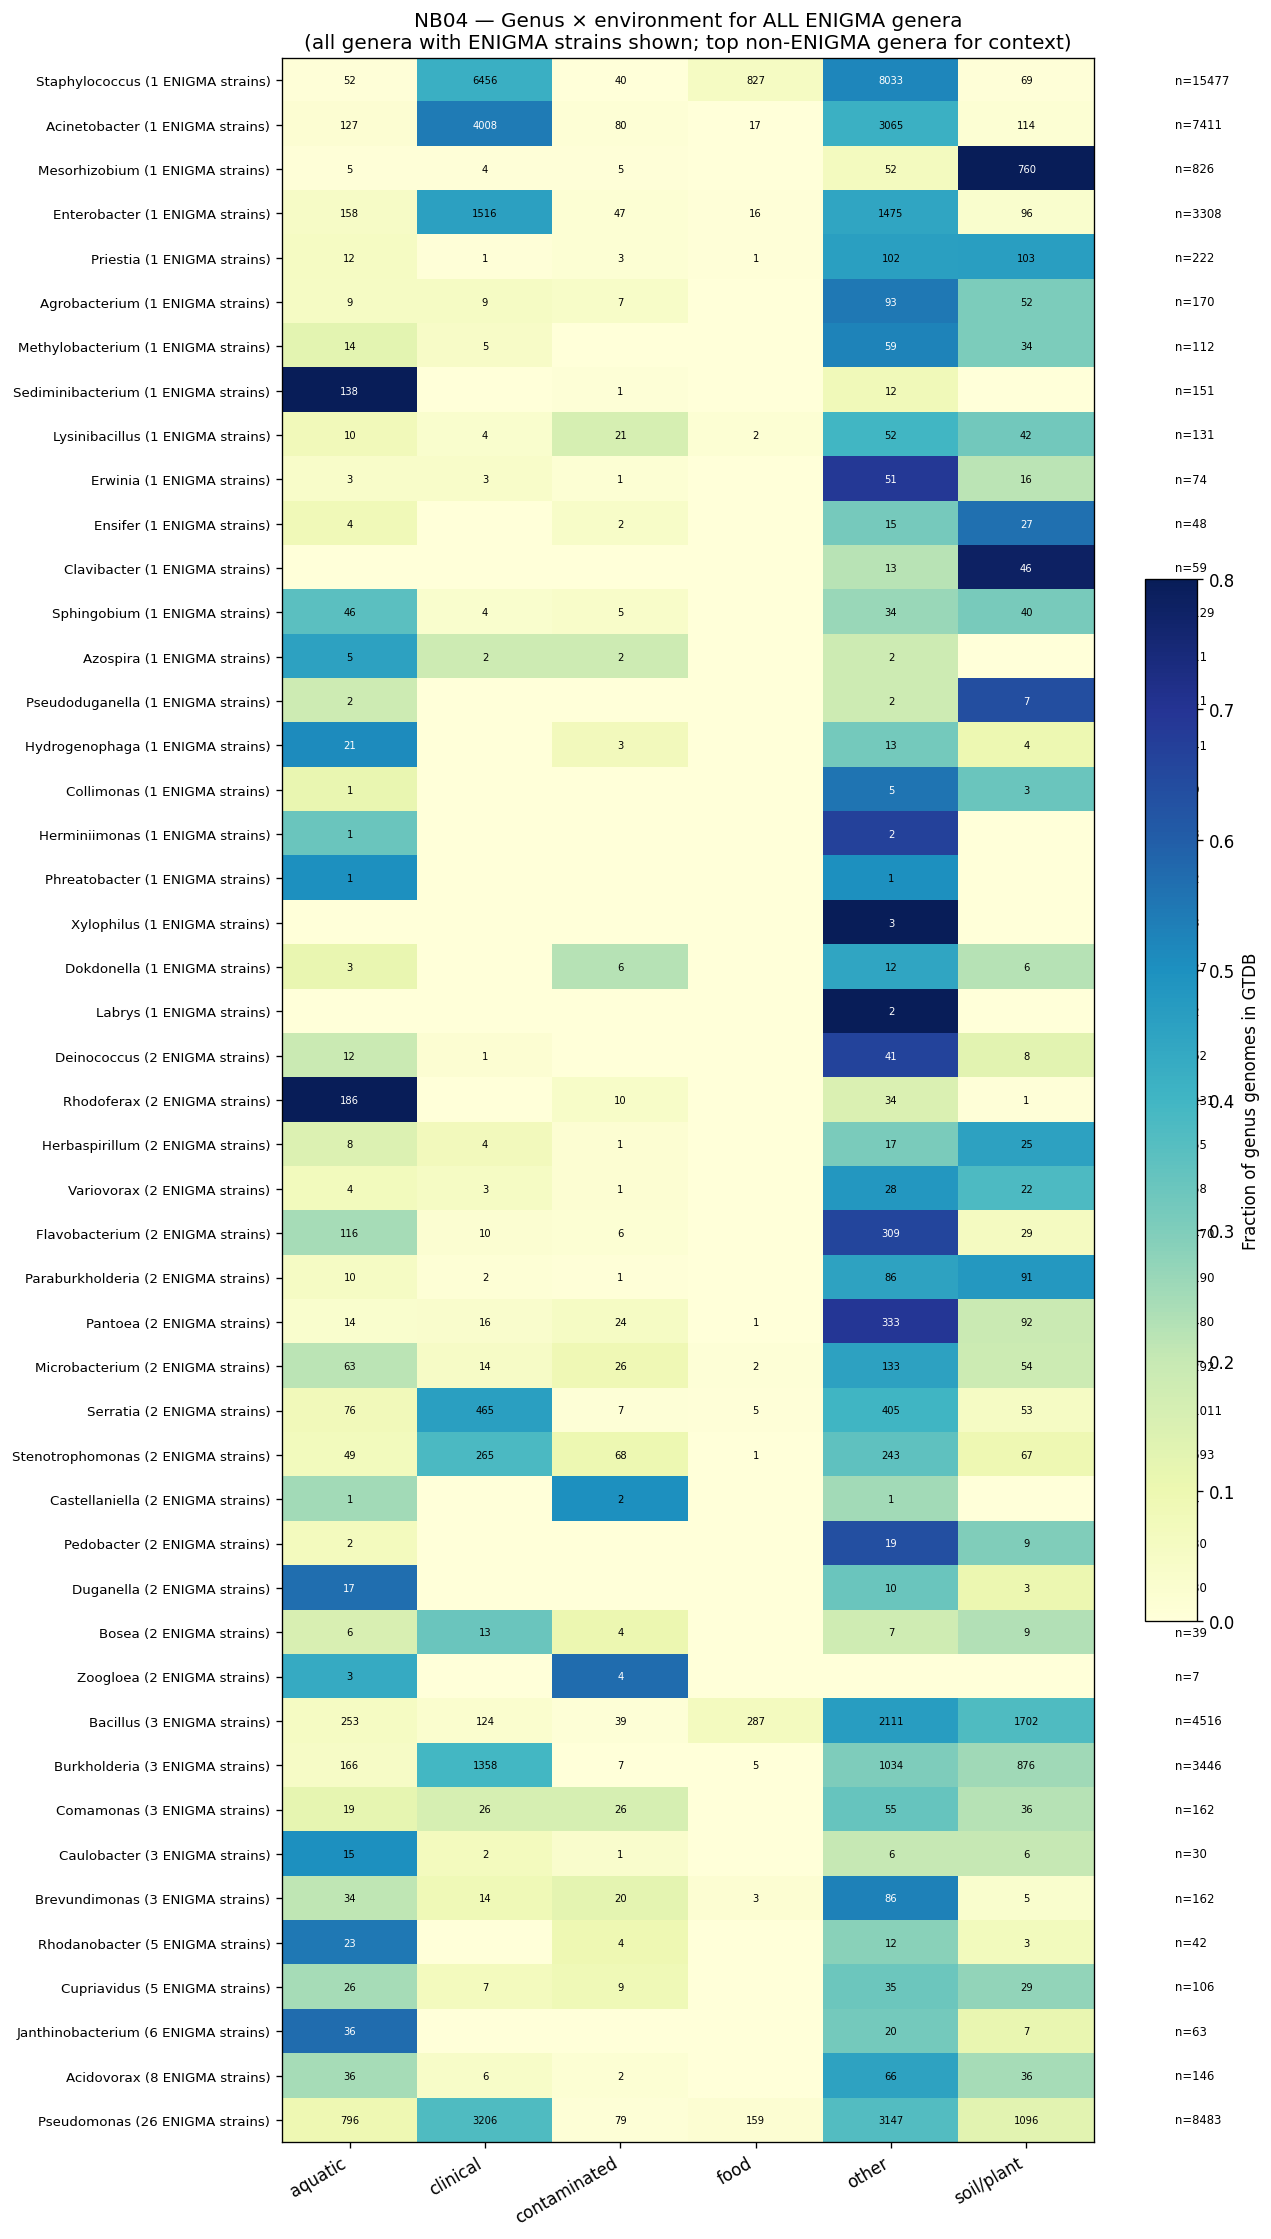
Nb04 Genus Env Heatmap
Nb04 Global Cooccurrence
Nb04 Global Genus Occurrence
Nb04 Oak Ridge Strain Map
Nb04 Oakridge Cooccurrence
Nb04 Pangenome Env Profiles
Nb04 Well Guild Distribution
Nb05 Feature Summary
Nb05 Ko Prevalence Filter
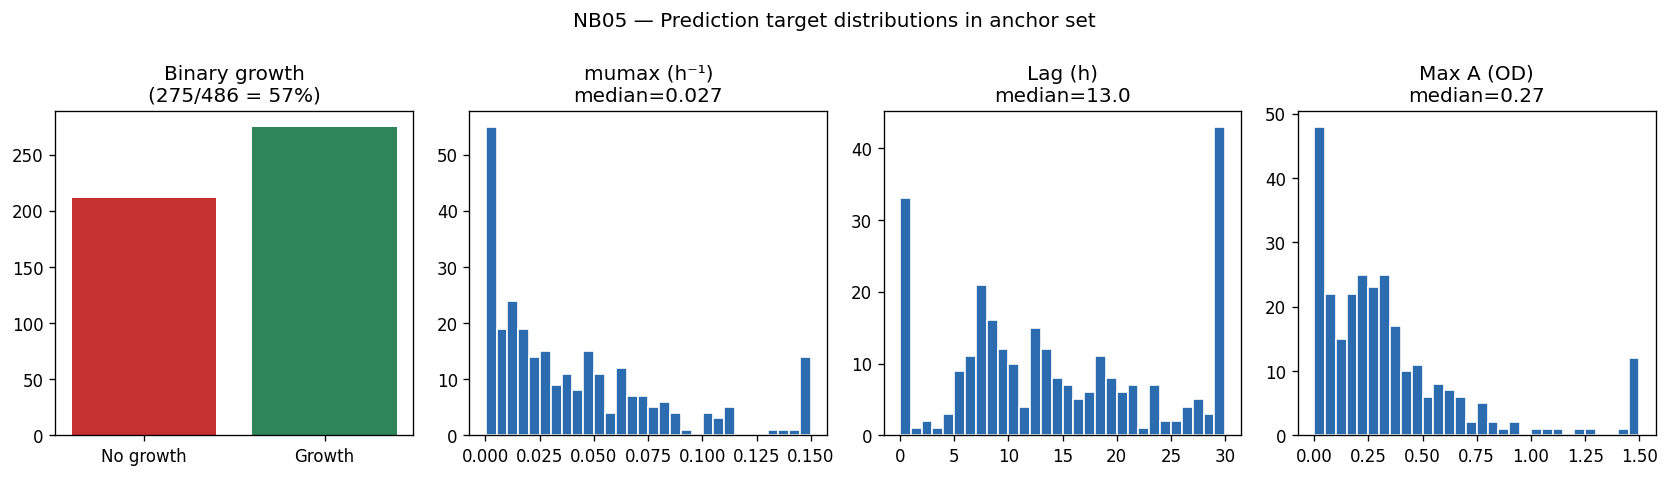
Nb05 Target Distributions
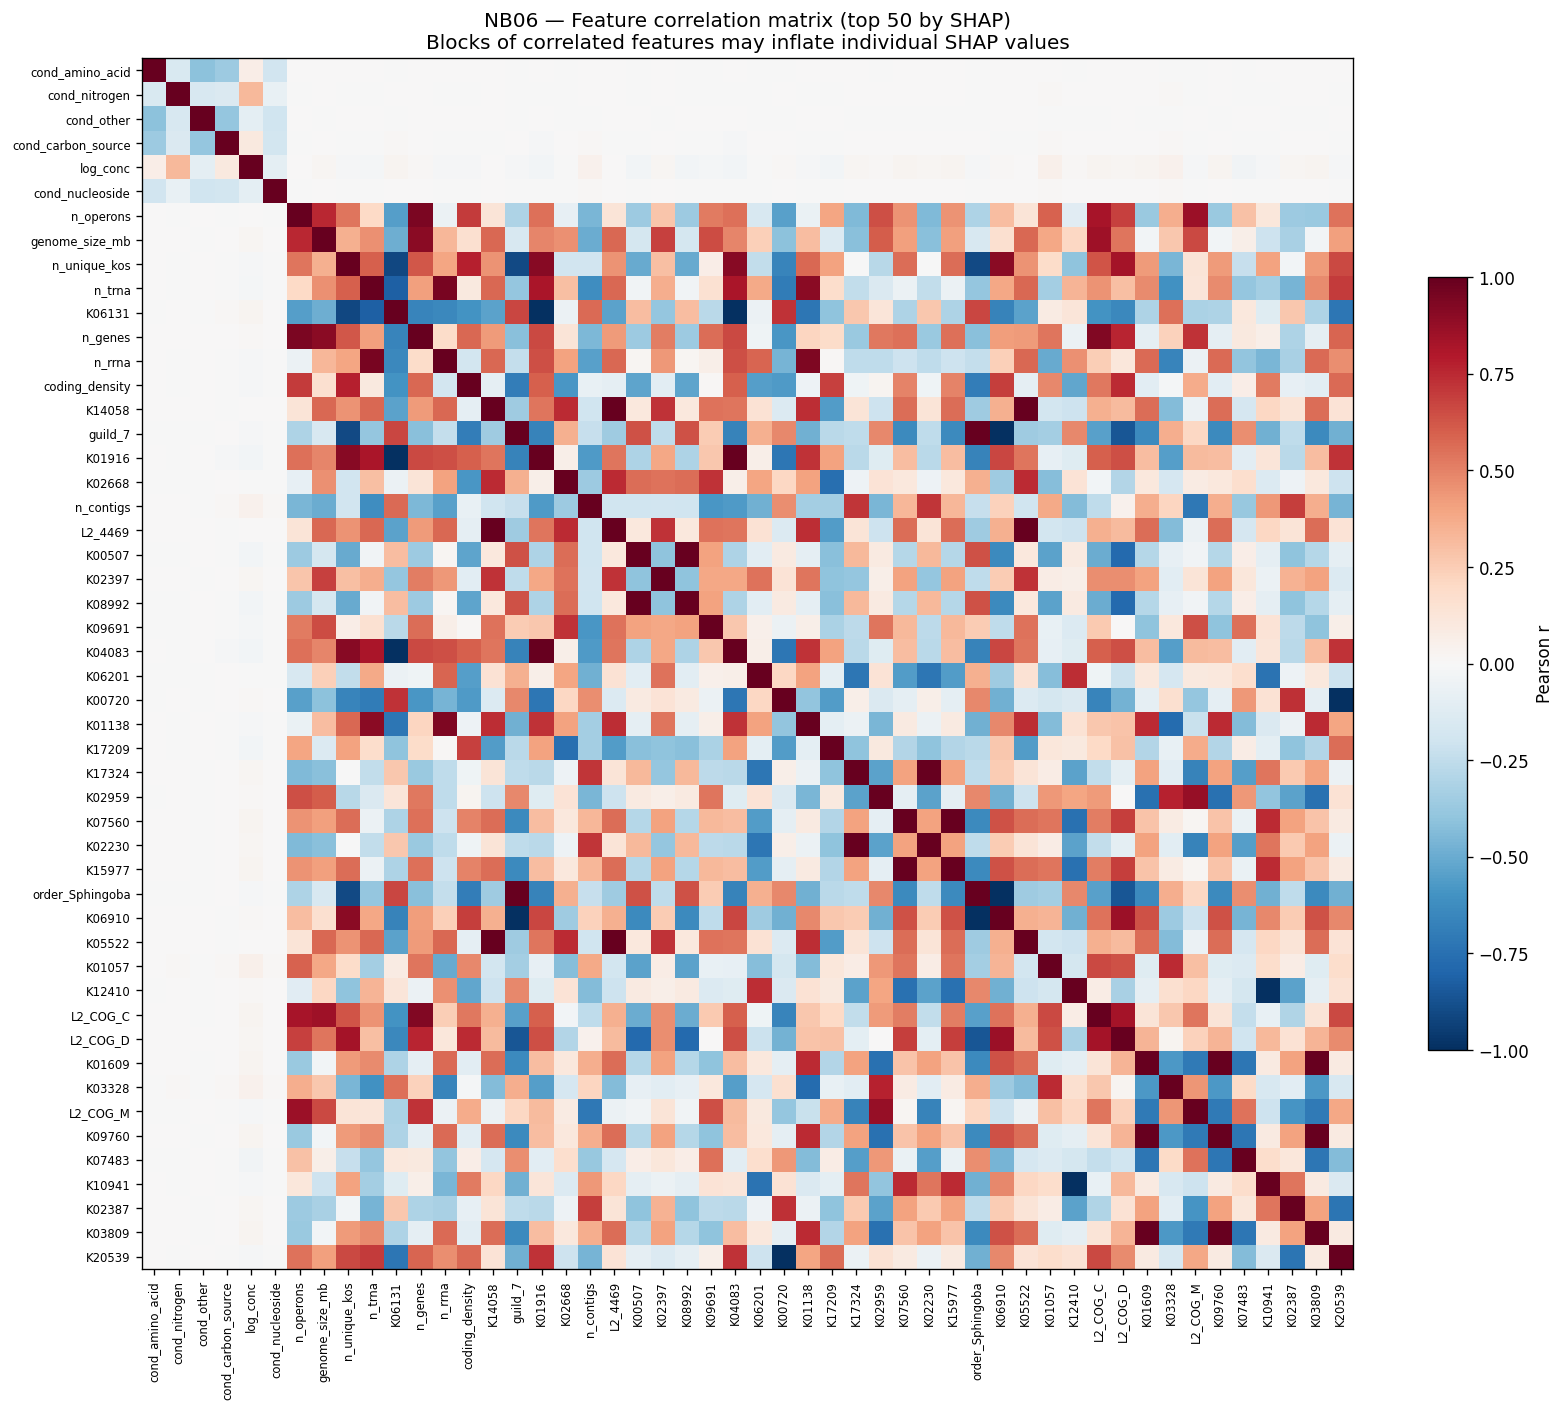
Nb06 Feature Correlation
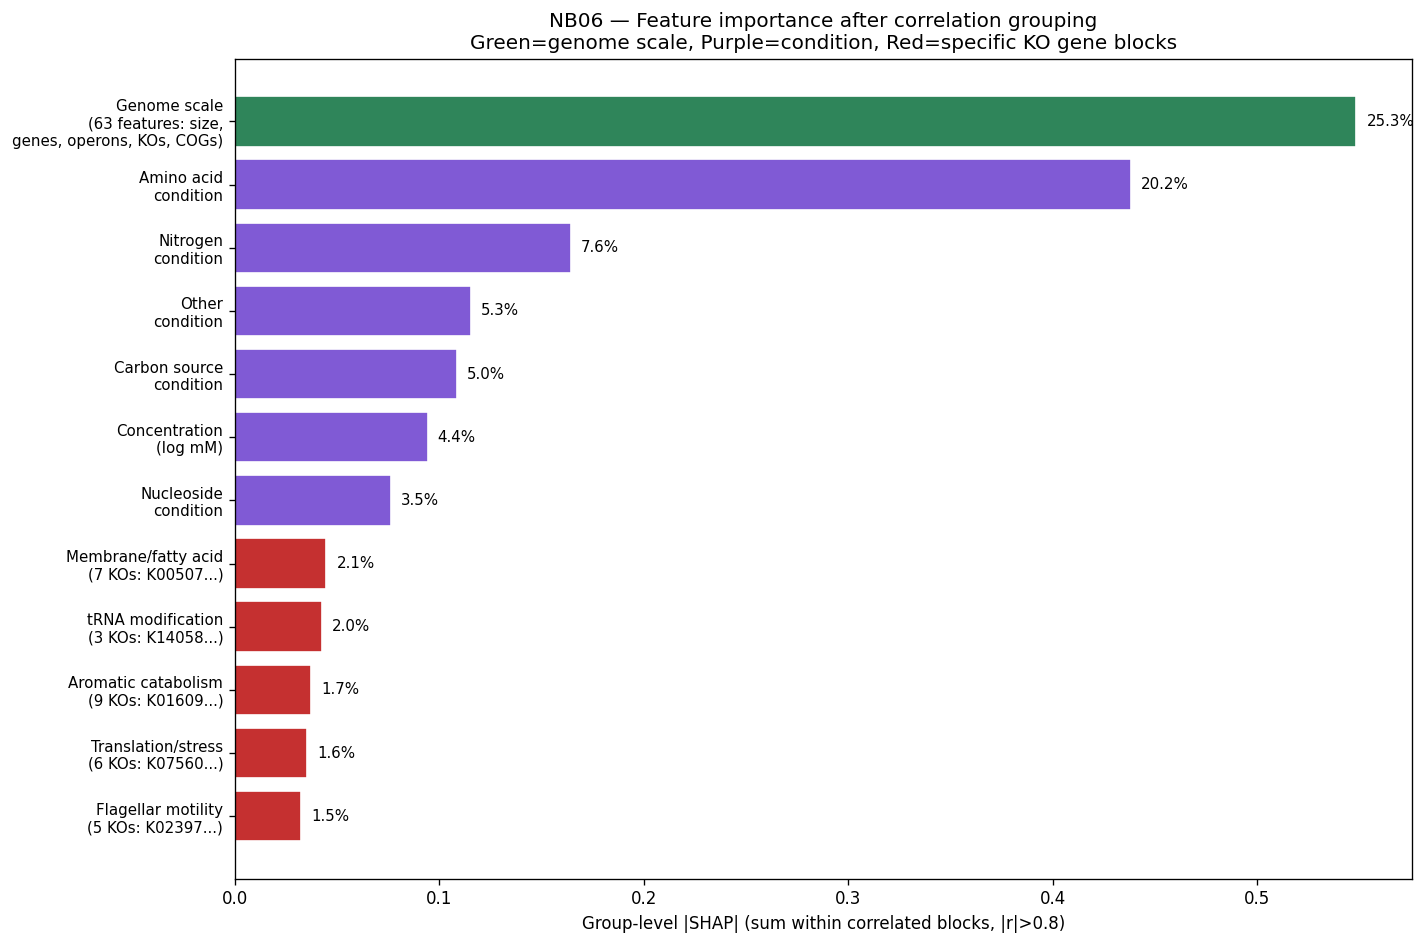
Nb06 Group Shap
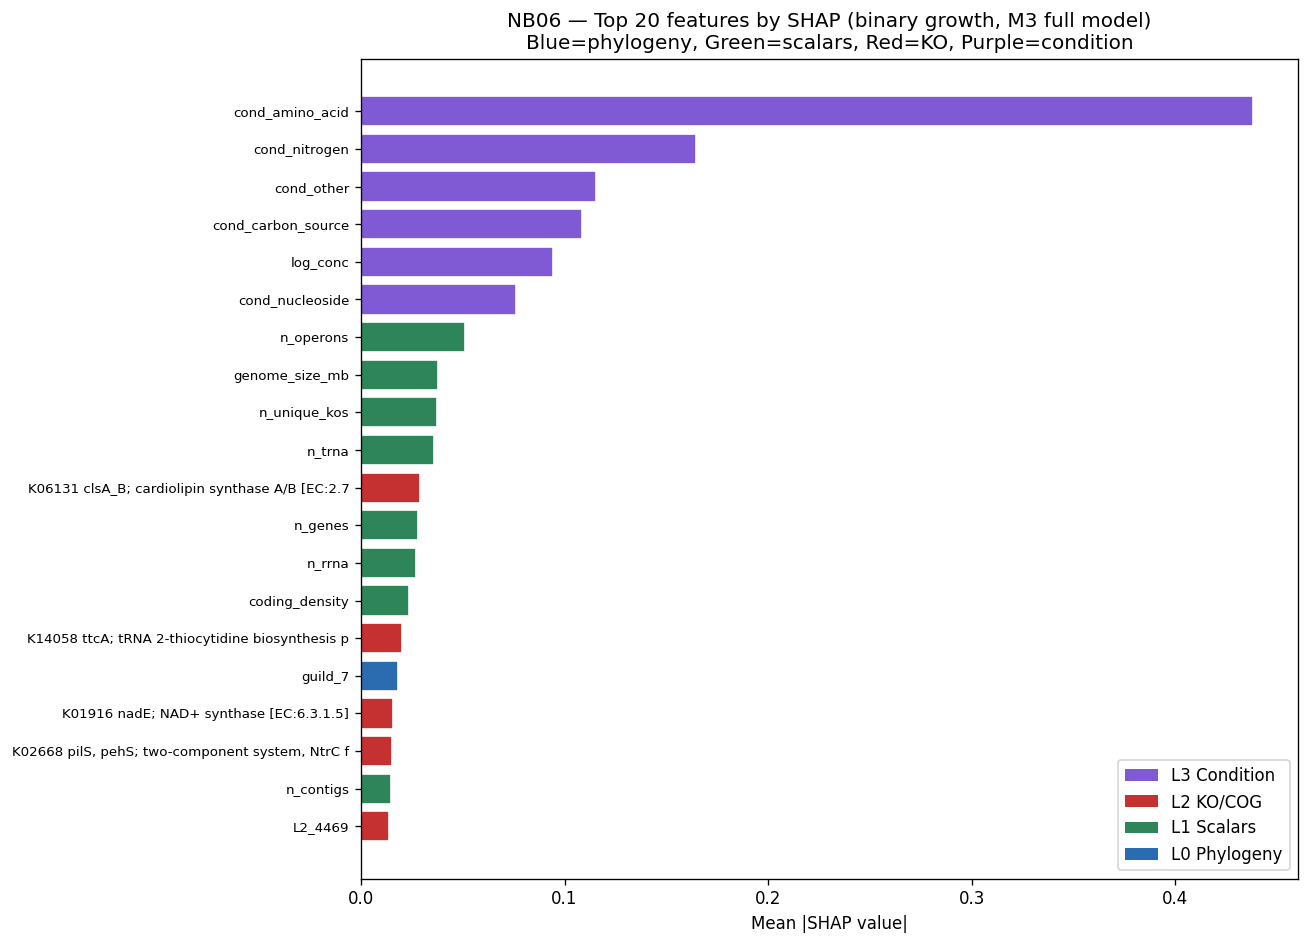
Nb06 Shap Top20
Nb06 Variance Partition
Nb07 Bulk Vs Continuous
Nb07 Confusion Matrices
Nb07 Coverage Gap
Nb07 Fb Concordance
Nb07 Fb Concordance Detail
Nb07 Full Corpus Results
Nb07 Full Corpus Shap
Nb07 Model Comparison
Nb07 Model Diagnostics
Nb07 Per Condition Auc
Nb07 Roc Curves
Nb07 Shap Beeswarm
Nb07 Shap Comparison N7 Vs Full
Nb08 Fb Cognate Results
Nb08 Mechanistic Examples
Nb08 Method Comparison
Nb08 Production Ko Heatmap
Nb08 Wom Prediction
Nb09 Active Learning Candidates
Nb09 Conflict Detection
Nb10 Active Learning Proposal
Notebooks
NB00_data_survey.ipynb
Nb00 Data Survey
View notebook →
NB01_curve_fitting.ipynb
Nb01 Curve Fitting
View notebook →
NB02_condition_canonicalization.ipynb
Nb02 Condition Canonicalization
View notebook →
NB02_wom_strain_crossmatch.ipynb
Nb02 Wom Strain Crossmatch
View notebook →
NB03_functional_census.ipynb
Nb03 Functional Census
View notebook →
NB04_environmental_context.ipynb
Nb04 Environmental Context
View notebook →
NB05_feature_engineering.ipynb
Nb05 Feature Engineering
View notebook →
NB06_variance_partition.ipynb
Nb06 Variance Partition
View notebook →
NB07_condition_specific_prediction.ipynb
Nb07 Condition Specific Prediction
View notebook →
NB07_full_corpus_prediction.ipynb
Nb07 Full Corpus Prediction
View notebook →
NB08_wom_exometabolomic_prediction.ipynb
Nb08 Wom Exometabolomic Prediction
View notebook →
NB09_conflict_detection.ipynb
Nb09 Conflict Detection
View notebook →
NB10_active_learning_proposal.ipynb
Nb10 Active Learning Proposal
View notebook →
Data Files
| Filename | Size |
|---|---|
active_learning_candidates.tsv |
43.5 KB |
anchor_set.tsv |
68.6 KB |
bulk_continuous_results.tsv |
0.3 KB |
cluster_env_comparison.tsv |
0.1 KB |
cog_class_descriptions.tsv |
0.9 KB |
cog_matrix.tsv |
17.0 KB |
condition_canonical.tsv |
95.3 KB |
coral_strain_locations.tsv |
12.2 KB |
coverage_matrix.tsv |
1932.6 KB |
csp_transfer_predictions.tsv |
25.5 KB |
fb_concordance.tsv |
0.4 KB |
fb_concordance_matched.tsv |
0.6 KB |
fb_ko_mapping.tsv |
54.2 KB |
feature_correlation_groups.tsv |
16.0 KB |
full_corpus_binary_results.tsv |
11.5 KB |
full_corpus_predictions.tsv |
3280.8 KB |
full_corpus_shap.tsv |
337.8 KB |
gapmind_predictions.tsv |
15.2 KB |
global_genus_cooccurrence_jaccard.tsv |
6.3 KB |
group_shap_importance.tsv |
2.2 KB |
interaction_feature_comparison.tsv |
11.6 KB |
ko_matrix.parquet |
4021.2 KB |
microbeatlas_genus_summary.tsv |
0.4 KB |
model_predictions.tsv |
82.4 KB |
oakridge_genus_cooccurrence.tsv |
4.6 KB |
pangenome_env_profiles.tsv |
1.8 KB |
per_condition_accuracy.tsv |
27.7 KB |
proposed_experiments.tsv |
7.2 KB |
shap_importance.tsv |
298.1 KB |
strain_scalars.tsv |
22.7 KB |
variance_partition.tsv |
1.0 KB |
wom_fb_ko_correlations.tsv |
83.0 KB |
wom_prediction_results.tsv |
0.4 KB |
wom_predictions.tsv |
31.0 KB |