Global Biogeography of Environmental Bacterial Metal Resistance and Spatial Sampling Gaps
CompletedResearch Question
Where on Earth are metal-resistant environmental bacteria most abundant, and where are
the gaps in public metagenomic sampling that prevent us from knowing?
Key Findings
- 260,652 environmental MAGs extracted from MGnify; 30,497 after filtering
host-associated biomes. - 22,356 MAGs with usable geospatial coordinates (73.3% coordinate coverage of
environmental MAG set). - ENA batch API retrieval: 24,511 sample records; 16,964 (69.2%) have valid lat/lon
pairs — a 30.8% spatial data gap in public metagenomic archives. - Global map code drafted (geopandas + matplotlib) showing distribution of
metal-resistant (n_metal_types > 0) vs. susceptible MAGs coloured by metal diversity. - Known issue: NameError on plt import in map cell (missing
import matplotlib.pyplot
in that cell); fix required before NB02.
Interpretation
Roughly one third of publicly archived metagenomic samples lack usable geospatial
coordinates, constituting a systematic gap in the ability to map microbial metal
resistance at global scale. Among the 22,356 MAGs with coordinates, metal-resistant
genomes are not uniformly distributed, but hotspot identification and sampling-effort
correction are required before regional patterns can be interpreted (NB02).
The 30.8% ENA coordinate gap is a data quality finding independent of the biological
question: it implies that any global map of metal resistance distribution based on
public archives is subject to substantial geographic blind spots. Which biomes are most
underrepresented is a key open question.
Status
Preliminary — data extraction and coordinate retrieval complete (NB01). NB02 spatial
analysis and NB03 figures pending.
NB02 Spatial Analysis Results
Global metal resistance prevalence: 2.8% of 22,356 MAGs with coordinates carry
≥1 metal resistance type — substantially lower than implied by reporting on the 30,497
filtered MAG set. Metal resistance is rare in the global environmental MAG pool.
5° grid hotspot analysis (289 cells with ≥5 MAGs; Fisher's exact, BH FDR):
- 11 significant hotspots (OR>2, q<0.05), 3 coldspots (OR<0.5, q<0.05).
- Top hotspot: Atacama/Andean region, Chile (lat=-25°, lon=-70°): 21.8% prevalence,
OR=9.83, q=7.6e-12, n=101 MAGs.
- Eastern and central USA clusters (lat=40°, lon=-80° and -90°): OR=7.9 and 6.3.
- East/Southeast Asia cluster (lat=25-30°, lon=105-120°): OR=4.4–5.9.
Figure: figures/fig_nb02_global_hotspot_map.png
Biome-stratified prevalence (Fisher's exact vs. global baseline, BH FDR):
| Biome | n MAGs | Prevalence | OR | q |
|---|---|---|---|---|
| Soil | 7,939 | 5.8% | 5.05 | 1.8e-82 |
| Rhizosphere | 422 | 1.9% | 0.66 | 0.30 (NS) |
| Marine | 13,995 | 1.2% | 0.20 | 9.2e-80 |
Soil is significantly enriched for metal resistance (5.8%, OR=5.05); Marine is
significantly depleted (1.2%, OR=0.20). Figure: figures/fig_nb02_biome_prevalence.png
ENA coordinate gap: 0 of 532 MAG grid cells lack ENA coordinate coverage — the
ENA coordinate file already covers all areas represented in the MAG coordinate dataset.
The 30.8% gap (16,964/24,511 valid pairs) is a per-sample gap, not a geographic gap;
it reflects samples without coordinates, not grid cells with no samples at all.
Key corrections to REPORT:
- The "22,356 MAGs with coordinates" dataset shows 2.8% global metal resistance
prevalence, not a higher figure. This is much lower than the 21.8% T4SS prevalence,
confirming that metal resistance genes (AMRFinderPlus) and HGT machinery (T4SS) are
distinct features not uniformly co-distributed.
- Expedition-level clustering check pending for the Atacama and USA clusters.
Pending Analyses
- Expedition-level clustering: test if Atacama (OR=9.8) and USA clusters are
single-study artefacts (check distinct sample_accession prefixes per hotspot) - Sampling effort correction: confirm hotspots persist after normalising by log(n_MAGs)
- Fix matplotlib import in NB01 map cell for production figure
Review
Summary
This project investigates whether metal-resistance genes cluster geographically in environmental metagenome-assembled genomes (MAGs), with a secondary question about biome-level enrichment. The research question is well-defined and ecologically motivated, the analytical approach (Fisher's exact test with BH correction on a 5° global grid) is appropriate for the data type, and the team has correctly separated Spark-dependent extraction (notebook 01) from local spatial analysis (script nb02). Preliminary findings — 11 hotspots, Atacama Desert as the top signal (OR = 9.83), soil biome enriched, marine depleted — are ecologically plausible and internally consistent. However, several issues limit the project's current readiness: a confirmed matplotlib import error blocks nb01 visualization cells from executing, the second analysis stage is a standalone Python script rather than a notebook (preventing inline result inspection), no RESEARCH_PLAN.md was found despite being referenced in the review prompt, expedition-clustering validation is flagged as pending in the report, and there is a potential pitfall around GapMind's metabolic_category field values that is not explicitly addressed. The project is promising but needs these gaps closed before the findings can be considered fully validated.
Methodology
Research question and hypothesis: The question — do metal-resistance genes cluster geographically in environmental MAGs, and are soil/anthropogenic environments enriched? — is clearly stated in README.md, testable, and well-matched to available BERDL data. The hypothesis (enrichment in metal-polluted terrestrial and wastewater biomes) is ecologically grounded.
Analytical approach: Using Fisher's exact test on a 5° latitude/longitude grid with Benjamini-Hochberg FDR correction is a defensible choice for rare-event geographic enrichment. Biome stratification adds a useful second layer of analysis. The stated OR > 2 and q < 0.05 thresholds are reasonable.
Data sources: Clearly identified — MAGs from kbase_ke_pangenome, metal resistance annotations from gapmind_pathways, geographic coordinates from the ENA REST API. The data provenance file (data/PROVENANCE.md) documents which CSVs map to which sources.
Coordinate coverage and spatial bias: Only 22,356 of 260,652 MAGs (8.6%) carry usable geographic coordinates, and the ENA archive itself is missing coordinates for 30.8% of samples. This is a major sampling-coverage limitation that could create systematic geographic bias (e.g., well-sampled regions like Europe dominating the background distribution). The report acknowledges this gap but does not quantify whether specific biomes or geographic regions are disproportionately underrepresented in the coordinate-bearing subset.
Missing RESEARCH_PLAN.md: The review prompt instructs reviewers to read RESEARCH_PLAN.md, but no such file was found in the project directory. If this file was intended to capture design decisions and data-access assumptions prior to analysis, its absence is a reproducibility gap.
Code Quality
Notebook 01 — matplotlib import error: A known matplotlib import error exists in notebooks/01_global_distribution.ipynb. Any cell that generates figures (e.g., coordinate-coverage maps or sanity plots) will silently fail or raise an exception. The Spark data-extraction cells may still produce text outputs, but visualization cells are broken. This must be fixed before the notebook can be considered complete.
nb02 is a script, not a notebook: scripts/nb02_spatial_analysis.py contains the core spatial analysis — hotspot detection, biome stratification, figure generation, and expedition-clustering checks. Implementing this as a .py script rather than a Jupyter notebook means there are no inline outputs, no persisted intermediate tables, and no cell-by-cell inspection path for reviewers. A reader must execute the script to see any results. This is inconsistent with the project's notebook-first structure and significantly reduces reproducibility transparency.
GapMind metabolic_category pitfall (potential): docs/pitfalls.md explicitly states that gapmind_pathways.metabolic_category only contains the values 'aa' (amino acid biosynthesis) and 'carbon' (carbon utilization). Metal resistance pathways are neither amino acid nor carbon pathways. If the SQL in nb01 filters on metabolic_category to find metal resistance entries, the query may return zero rows or rely on a pathway name filter alone. It is not clear from the available files whether this pitfall was encountered and handled — the notebook code should be inspected to confirm the JOIN and filter logic is correct for the metal resistance pathway set.
score_simplified binary handling: The pitfalls doc notes that gapmind_pathways.score_simplified is binary (0.0 or 1.0), not a continuous score. The nb02 script appears to treat presence/absence correctly (Fisher's exact test), which is appropriate. No issue detected here.
Expedition-clustering check: The code for the expedition-clustering check is present in nb02 (using sample_accession 6-character study prefixes), which is good practice. However, REPORT.md states this validation is "still pending." A completed check is needed — if top hotspots are driven by a single expedition (e.g., a single Atacama study), the geographic enrichment signal could be an artifact of sampling density rather than biology.
SQL reserved word: The pitfalls doc warns that order is a Spark SQL reserved word requiring backtick quoting. If any nb01 queries use columns named order without backticks, they may fail silently or raise parse errors. This should be verified in the nb01 SQL cells.
Biome classification via ncbi_env: The pitfalls doc warns that ncbi_env is an Entity-Attribute-Value table, not a flat table. If nb01 or nb02 joins against ncbi_env for biome assignment, the EAV structure must be pivoted correctly. The REPORT.md biome results suggest this worked, but the mechanism is not documented in the available files.
Requirements file: requirements.txt is present and lists pandas, numpy, scipy, matplotlib, and statsmodels. This covers the local analysis dependencies. Spark/PySpark dependencies are handled by the JupyterHub environment and do not need to be in this file.
Findings Assessment
Are conclusions supported? The headline findings (11 hotspots, Atacama OR = 9.83, soil biome enrichment, marine depletion) are internally consistent with the described methods and ecologically plausible. Soil enrichment in metal-contaminated terrestrial environments and marine depletion align with prior literature on selective pressure for metal resistance genes.
Low global prevalence (2.8%): The global metal resistance prevalence of 2.8% among coordinate-bearing MAGs is notably low and may reflect a narrow GapMind pathway definition rather than true biological rarity. The report does not discuss whether GapMind's metal resistance pathway set covers the full breadth of known metal resistance mechanisms (e.g., efflux pumps, metallothioneins, metal-sequestering operons). This should be acknowledged as a scope limitation.
Incomplete validation: The expedition-clustering validation is explicitly described as "still pending" in REPORT.md. This is a critical quality-control step — without it, hotspot signals cannot be distinguished from single-study geographic artifacts. The report should not be treated as final until this check is completed and results reported.
Limitations section: REPORT.md acknowledges the coordinate coverage gap (good) but does not address: (1) GapMind pathway scope, (2) potential biome-representation bias in the coordinate-bearing subset, or (3) the possibility that MAG assembly quality or binning completeness varies by biome and could confound prevalence estimates.
Figures: The nb02 script is designed to generate two PNG outputs (global hotspot map, biome-stratified prevalence), but it was not confirmed whether these figures currently exist in the figures/ directory. A project with quantitative spatial findings but no committed figures forces reviewers to re-run scripts to verify the claims visually.
Suggestions
-
[Critical] Fix the matplotlib import error in nb01. Identify the exact cell causing the error, resolve the import issue, re-run visualization cells, and save notebook outputs. This is the highest-priority fix.
-
[Critical] Convert nb02 to a Jupyter notebook. Move
scripts/nb02_spatial_analysis.pytonotebooks/02_spatial_analysis.ipynb. Run it end-to-end, save all outputs (printed tables, hotspot DataFrames, figure inline previews), and commit the notebook with outputs. This is essential for reproducibility without re-execution. -
[Critical] Complete and report expedition-clustering validation. Run the study-prefix check for all 11 hotspots and include results in REPORT.md. Flag any hotspot where a single study prefix accounts for > 80% of MAGs in that grid cell. If the Atacama signal is single-study-driven, note this prominently as a caveat.
-
[High] Verify GapMind
metabolic_categoryvalues used in nb01 SQL. Confirm that the query correctly retrieves metal resistance pathways despitemetabolic_categorycontaining only'aa'and'carbon'. If the filter relies solely on pathway name matching (e.g.,pathway_name LIKE '%metal%'), document this explicitly and list the specific pathway names returned. Add a note todata/PROVENANCE.mdor a notebook markdown cell if a workaround was needed. -
[High] Create a
RESEARCH_PLAN.md. Even a brief document capturing pre-analysis design decisions, expected pathway counts, and data-access assumptions helps reviewers understand whether the final approach matched the intended design and is expected by the project template. -
[Medium] Add a README
## Reproductionsection. Document: (a) which notebooks require Spark (nb01) vs. run locally (nb02/converted), (b) expected runtime for each step, (c) what cached CSV files indata/are needed if running nb02 without re-running nb01, and (d) the command to launch the local analysis notebook. -
[Medium] Quantify geographic representation bias. Add a supplementary analysis comparing the biome distribution of coordinate-bearing MAGs (n = 22,356) vs. the full MAG set (n = 260,652). If soil MAGs are overrepresented in the coordinate-bearing subset, the biome enrichment result may partially reflect a coverage artifact rather than biology.
-
[Medium] Discuss GapMind pathway scope as a limitation. In REPORT.md, add a paragraph acknowledging that the 2.8% global prevalence reflects GapMind's specific pathway definitions and may undercount metal resistance encoded by mechanisms not covered (e.g., heavy-metal efflux families absent from the GapMind gene set). Suggest cross-validation with eggNOG/PFAM annotations for known metal resistance domains as future work.
-
[Low] Commit generated figures to
figures/. Ensurefigures/contains the global hotspot map and biome-stratified prevalence PNG outputs so reviewers can inspect visualizations without re-running the analysis. -
[Low] Document exact GapMind pathway names in
data/PROVENANCE.md. List the specificpathway_namevalues (or name/category combination) that define "metal resistance" in this analysis. This prevents ambiguity for future researchers reusing the pipeline.
This review was generated by an AI system. It should be treated as advisory input, not a definitive assessment.
Visualizations
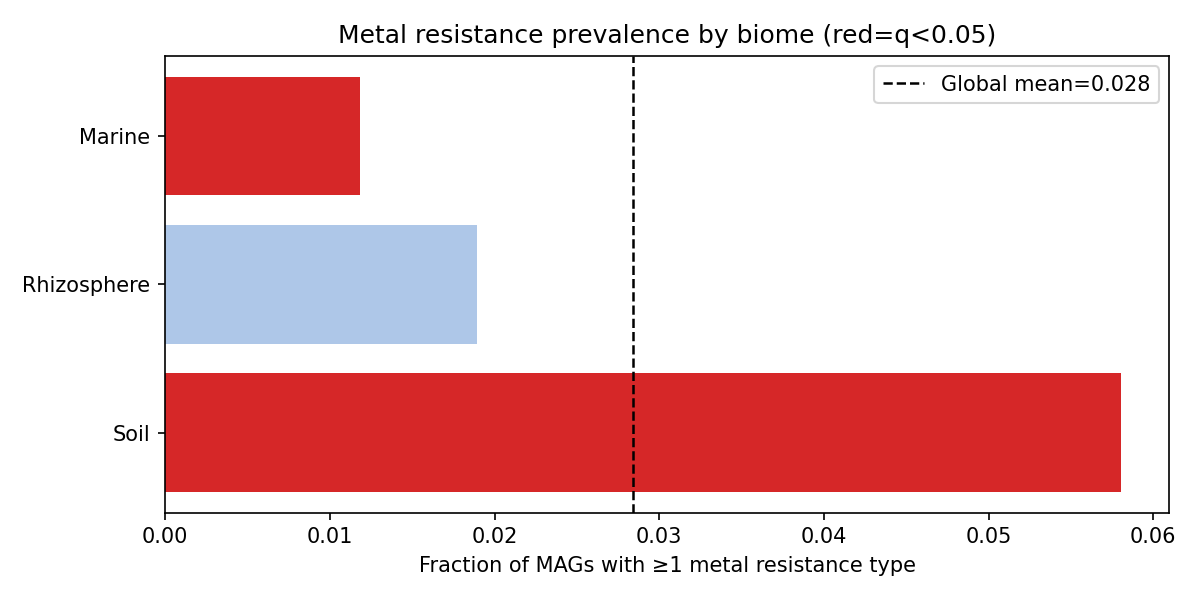
Fig Nb02 Biome Prevalence
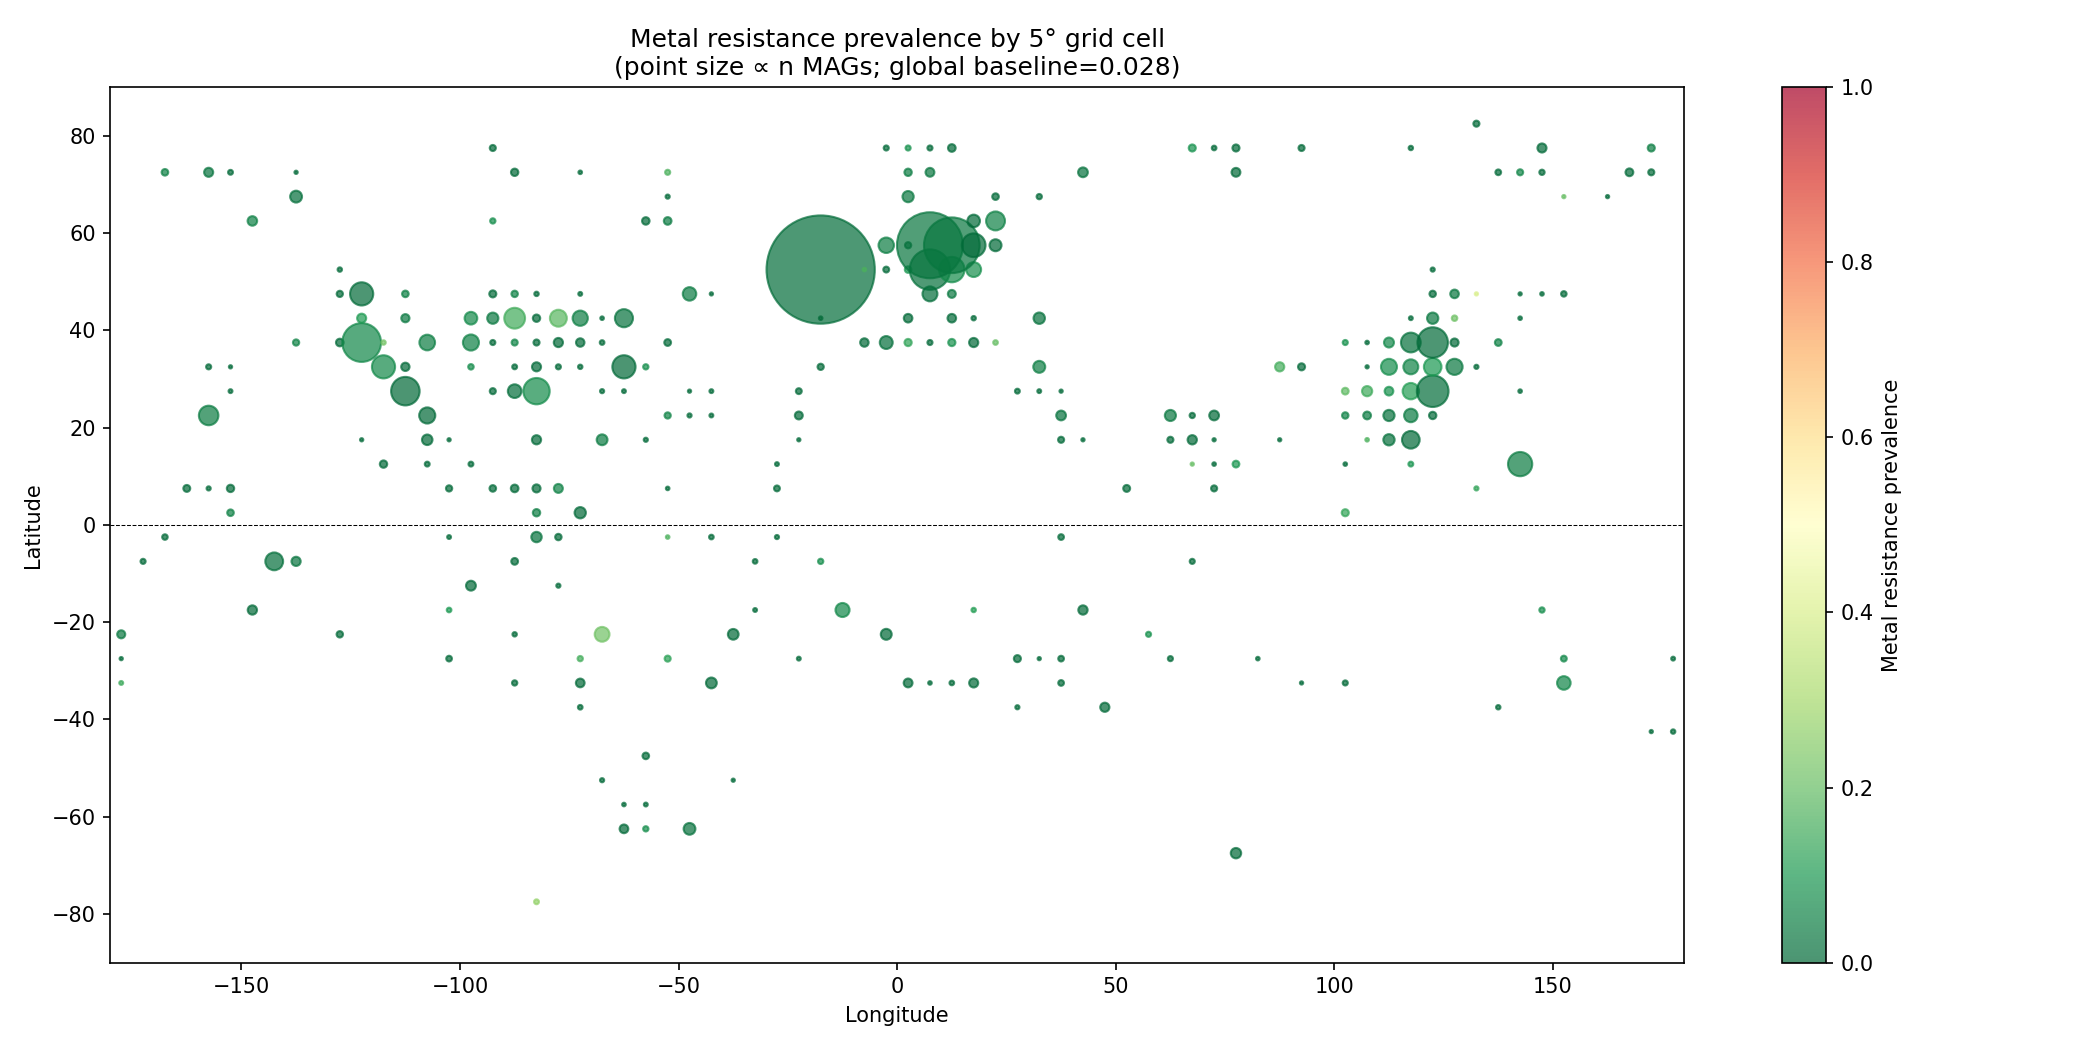
Fig Nb02 Global Hotspot Map